
Figure 2. HlyB and HlyD expression levels.
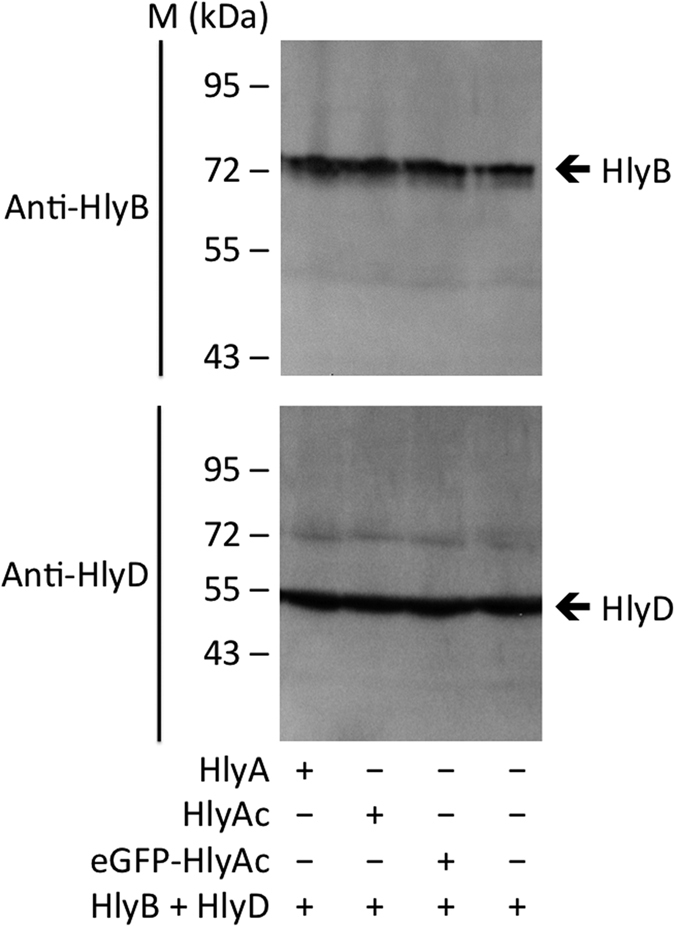
Western blot analysis of E. coli cells demonstrated that the expression levels of HlyB and HlyD were equal for cells expressing and/or secreting either eGFP-HlyAc, HlyA or HlyAc.
Official websites use .gov
A
.gov website belongs to an official
government organization in the United States.
Secure .gov websites use HTTPS
A lock (
) or https:// means you've safely
connected to the .gov website. Share sensitive
information only on official, secure websites.
Western blot analysis of E. coli cells demonstrated that the expression levels of HlyB and HlyD were equal for cells expressing and/or secreting either eGFP-HlyAc, HlyA or HlyAc.