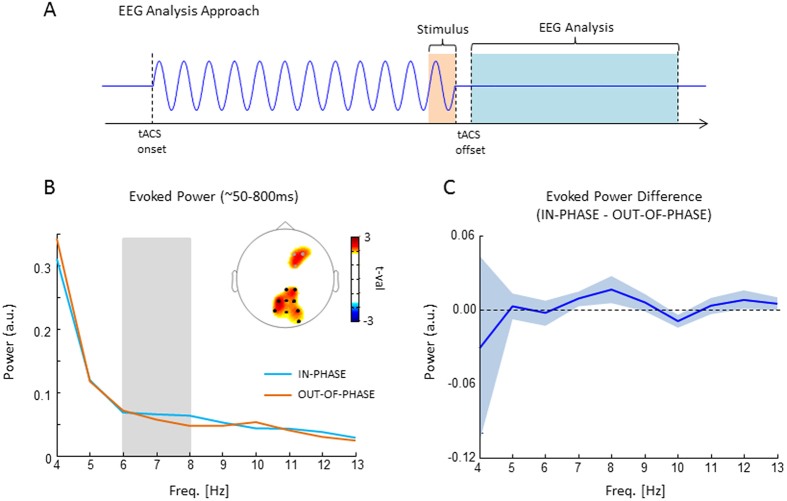
Figure 5. EEG results are shown.
(A) The analysis approach for EEG is illustrated. EEG epochs were time locked to tACS offset (as opposed to stimulus onset). The time window varied slightly from subject to subject depending on the artefacts introduced by tACS but on average corresponded to a length of 880 ms starting ~90 ms after tACS offset (light blue). The exact time windows were adjusted individually due to variable delays in tACS offset artefacts (see Methods). Evoked power was calculated as the power spectrum of the resulting ERP. (B) Evoked power is shown for the IN-PHASE and OUT-OF-PHASE condition. The topography shows significant differences (black dots = pcorr < 0.05; grey dots = pcorr = 0.11). (C) The difference between IN-PHASE and OUT-OF-PHASE in evoked power is shown averaged across the sign. parietal electrodes (i.e. black dots in B). Shaded areas represents mean s.e.

