
Figure 3.
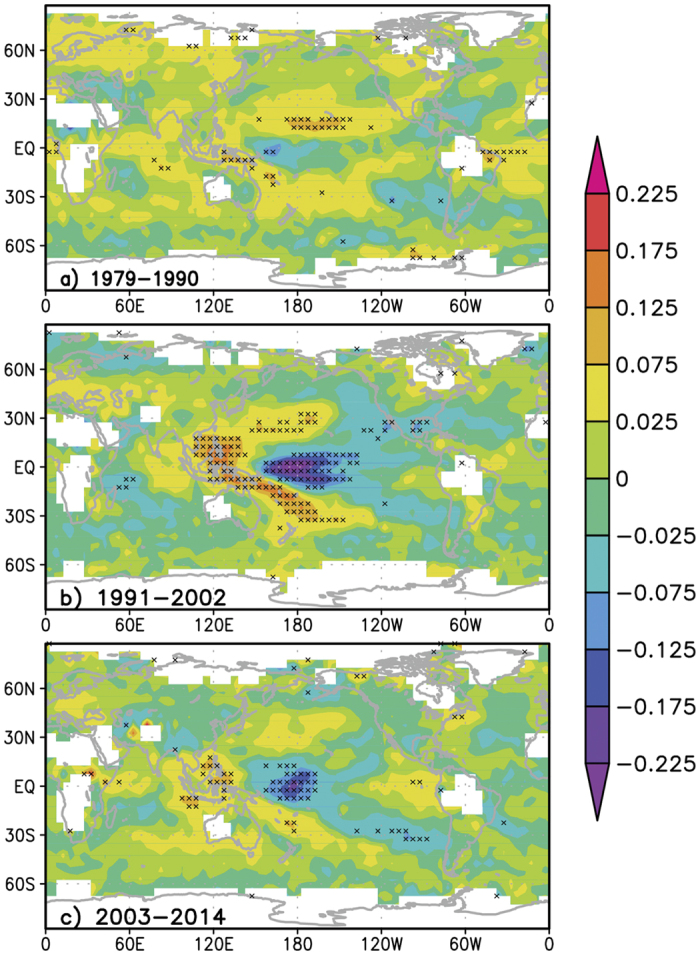
Spatial structures of the atmospheric greenhouse effect parameter anomaly (Gaa) trend on a 5° by 5° box using the least-squares approach during three subperiods: (a) 1979–1990, (b) 1991–2002, and (c) 2003–2004. Regions with a significant tendency (at the 0.05 confidence level based on the F-test) are crossed. Maps were generated by GrADS (http://www.opengrads.org/doc/wind32-v1/) version 1.90-rc1.