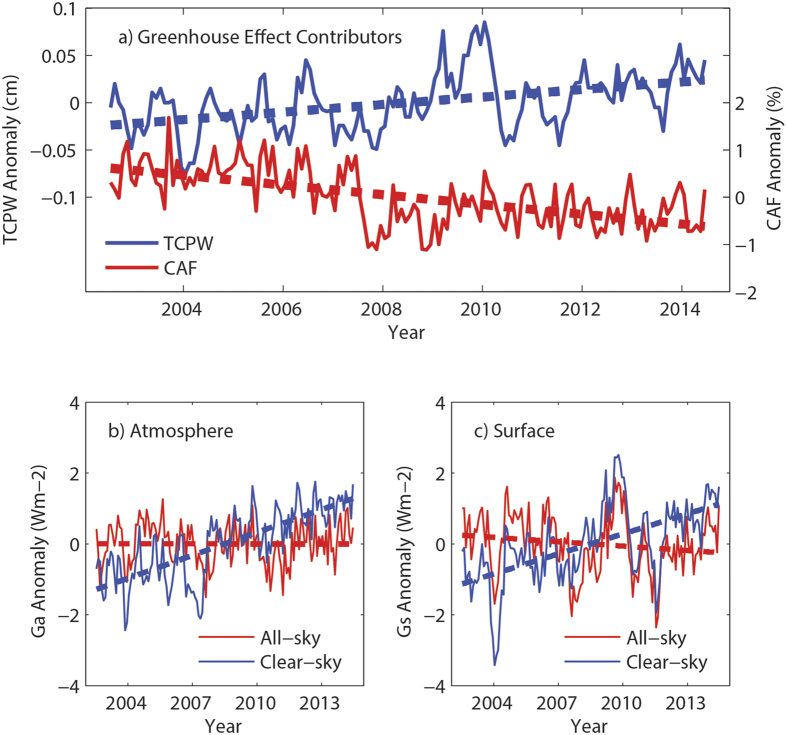
Figure 4.
(a) Monthly variations of the global averaged TCPW (unit: cm) and CAF (unit: %) anomalies between 2003 and 2014. Dashed lines are the linear trend lines obtained by the least squares method. (b) Monthly variations of the atmospheric greenhouse effect parameter anomaly (Gaa; unit: W m−2) from 2003 to 2014 for all-sky (red lines) and clear-sky (blue lines) conditions. Dashed lines are the linear trend lines obtained by the least squares method. (c) Same as (b) but for the surface greenhouse effect parameter anomaly (Gsa; unit: W m−2). The figure was plotted using MATLAB software.

