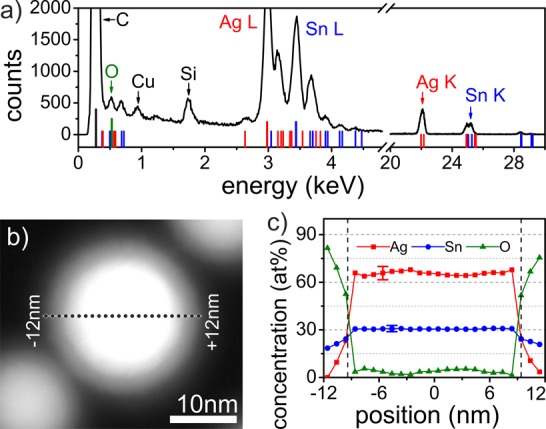
Figure 3.

(a) Summed EDXS spectra of a Ag–Sn core/shell nanocrystal after the exchange reaction. Indicated red, blue, and green lines are the characteristic X-ray lines of Ag, Sn, and O. (b) HAADF STEM image of the investigated nanocrystals. A dashed line shows the position of the taken EDXS line scan. (c) Atomic concentrations extracted from the EDXS line scan of the nanocrystal shown in panel b. In the core region (between the dashed lines) the contribution from the shell was subtracted as described in the text. Two representative error bars for the Ag and Sn concentrations define the 2σ-confidence levels of the analyzed peaks.
