
Figure 1. Comparison of relative telomere length for UCP2 SNPs rs659366 and rs660339.
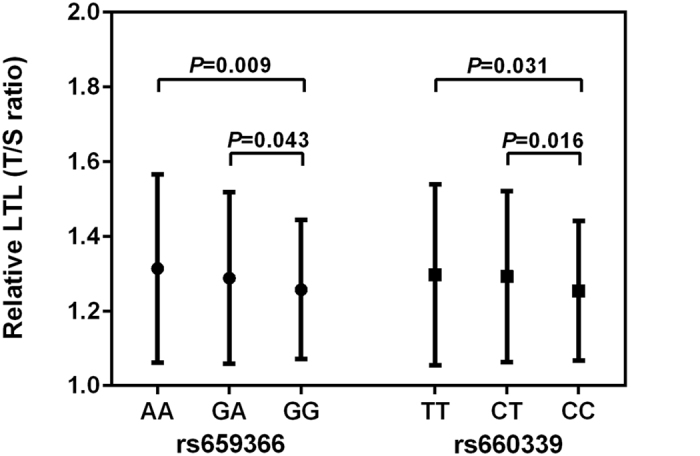
ANOVA was applied to measure the difference between sub-genotypes of rs659366 (P = 0.017) and rs660339 (P = 0.026), followed by post hoc multiple comparisons via the LSD method of which P values were presented in the figure.