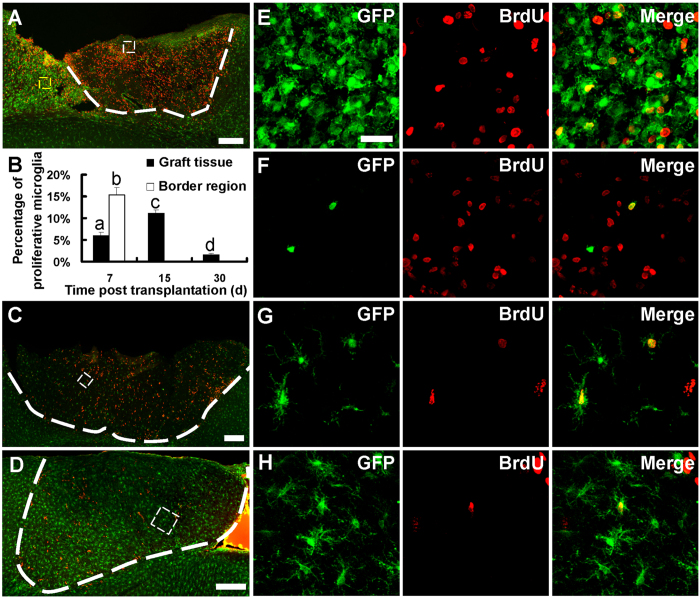
Figure 3. Proliferation of host-derived microglia at different time points after transplantation.
(A,C,D) Confocal images showing proliferative microglia (BrdU-positive and GFP-positive) at 7 d, 15 d and 30 d after transplantation. Note the graft was from a wild-type mouse and host animal was a CX3CR1GFP/+ mouse. White dash line shows the boundary of grafted tissue. (B) Percentage of proliferative microglia in grafted tissue and host part of border region at different time points. N = 3 sections/mouse, 3–4 mice/group. a, b, c, d indicating significant differences between the two groups. P < 0.01. (E) Higher magnification image of the yellow box region in (A) showing BrdU-positive microglia in host part of the border region next to grafted tissue at 7 d. (F–H) Higher magnification image of the white box region in (A,C,D) showing BrdU-positive microglia in grafted tissue at 7 d, 15 d and 30 d after transplantation. Scale bar, 200 μm (A,C,D); 25 μm (E–H).

