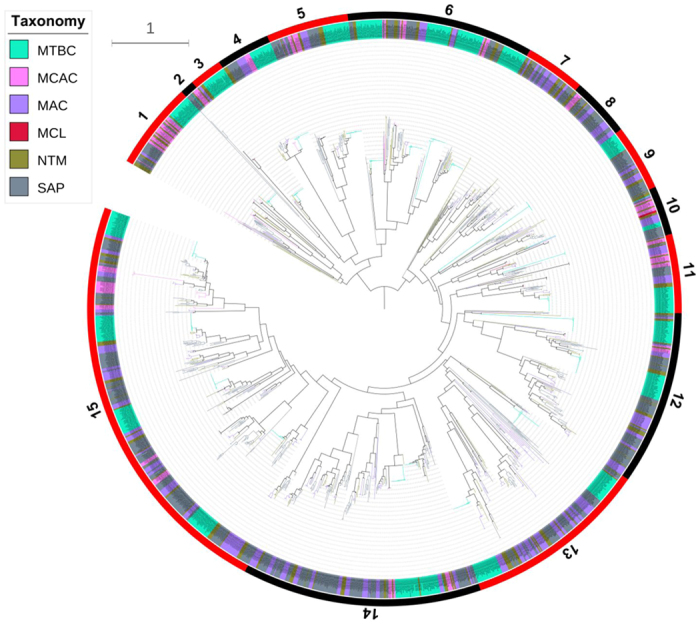
Figure 2. Phylogenetic analysis of P450s in mycobacteria.

A phylogenetic tree was constructed with 1772 mycobacterial P450s. The inner circle is the phylogenetic tree based on the consensus sequences of the mycobacterial P450s against the Pfam seed PF00067. The branches with different colors show their taxonomic groups: MTBC (Mycobacterium tuberculosis complex), MCAC (Mycobacterium chelonae-abscessus complex), MAC (Mycobacterium avium complex), MCL (Mycobacteria causing leprosy), NTM (Nontuberculous mycobacteria) and SAP (Saprophytes). Ancestral branches with children that had identical colors were assigned the same color as the children. The middle circle shows the corresponding CYPs, which are covered by different colors to show their taxonomic groups. Each taxon links the branch with a dotted line. The outermost numbers indicate the 15 clades based on this study, and their ranges are marked by alternating red and black. Distribution of P450s families into different clans was listed in Supplementary Table S5. A high-resolution phylogenetic tree is provided in the supplementary Fig. S1.
