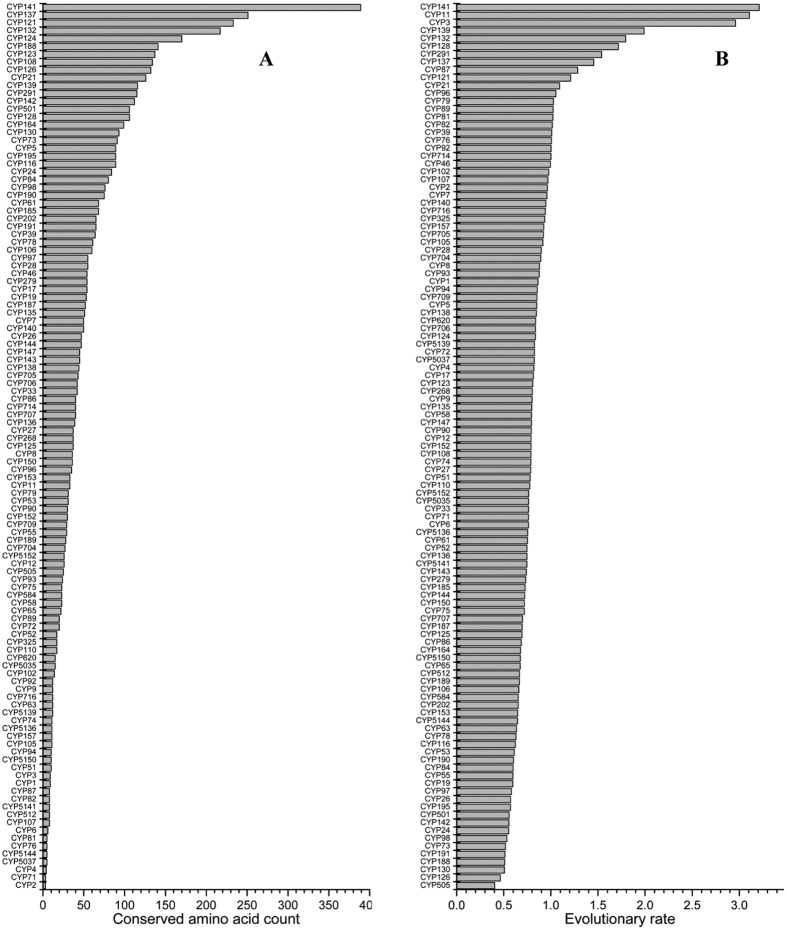
Figure 5. Protein-level (A) and DNA-level (B) P450s structural dynamic analysis.
Structural dynamics for 17 598 P450s belonging to 113 P450 families from different biological kingdoms were analyzed. (A) Protein-level structure dynamics were assessed based on the number of conserved amino acids present in each P450 family. The P450 families in the graph are presented such that the P450 family CYP141 that has the highest number of conserved amino acids is on top of the graph and the lowest number of conserved amino acids observed for the CYP2 family is on the bottom of the graph. A detailed analysis of the number of conserved amino acids and number of member P450s used and their hosts (biological kingdoms) and conservation ranking for each member of the family is presented in Supplementary Table S8. (B) Evolutionary rate analysis of P450s. Evolutionary rates were estimated based on their cDNA sequences under the Tamura-Nei model40. A discrete Gamma distribution was used to model the evolutionary rate differences, as X axis of Fig. 5B presents, and more details are provided in Methods section. A discrete Gamma distribution was used to model the evolutionary rate differences. The P450 families in the graph are presented such that the P450 family CYP141 showing the lowest evolutionary rate is on top of the graph and the highest evolutionary rate observed for the CYP505 family is on the bottom of the graph. A detailed analysis of evolutionary rates for each of the P450 family and their ranking is presented in Supplementary Table S9.

