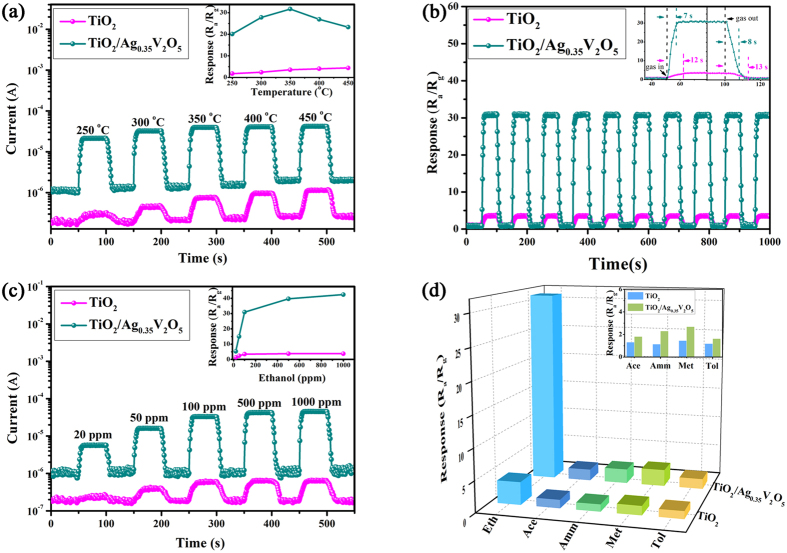
Figure 4. Gas sensing performance of the sensors.
(a) Gas sensing properties versus different operating temperatures of the pure TiO2 nanofibers and TiO2/Ag0.35V2O5 branched nanoheterostructures based sensors exposed to 100 ppm ethanol. The inset shows the corresponding responses. (b) Reproducibility of the two sensors exposed to 100 ppm successive ethanol vapors (10 cycles) at 350 °C. The inset is the typical response and recovery curves of the two different types of sensors. (c) Dynamic response-recovery curves of the two sensors to ethanol vapors at 350 °C in the concentration sequence of 20, 50, 100, 500 and 1000 ppm. The inset is the corresponding responses. (d) Selective tests of TiO2/Ag0.35V2O5 branched nanoheterostructures compared with TiO2 nanofibers based sensors exposed to 100 ppm ethanol (Eth), acetone (Ace), ammonia (Amm), methanol (Met), and toluene (Tol) at 350 °C.

