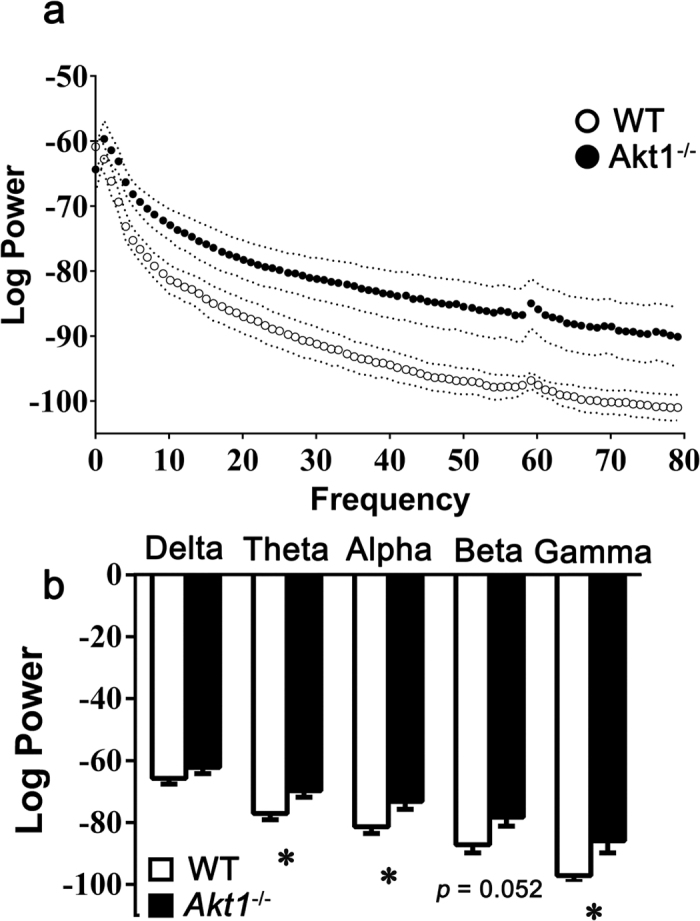
Figure 5. Experiment 5: Altered neural oscillations from the hippocampal CA1 region were identified in anaesthetized female Akt1−/− mice compared to female WT littermate controls.

(a) The power spectrum density (mean ± SEM) of hippocampal LFPs in the high frequency ranges was greater in anaesthetized female Akt1−/− mice (white dot; n = 5) than in female WT controls (black dot; n = 5). Original data showing the log oscillation power from low frequency to high frequency (from left to right: 0–80 Hz; delta: 0–4 Hz; theta: 5–8 Hz; alpha: 9–12 Hz; beta: 12–30 Hz; and gamma: 30–80 Hz). (b) The average log oscillation power (mean ± SEM) in female Akt1−/− mice (black bar) was greater than that in WT controls (white bar) in the high frequency ranges. *p < 0.05.
