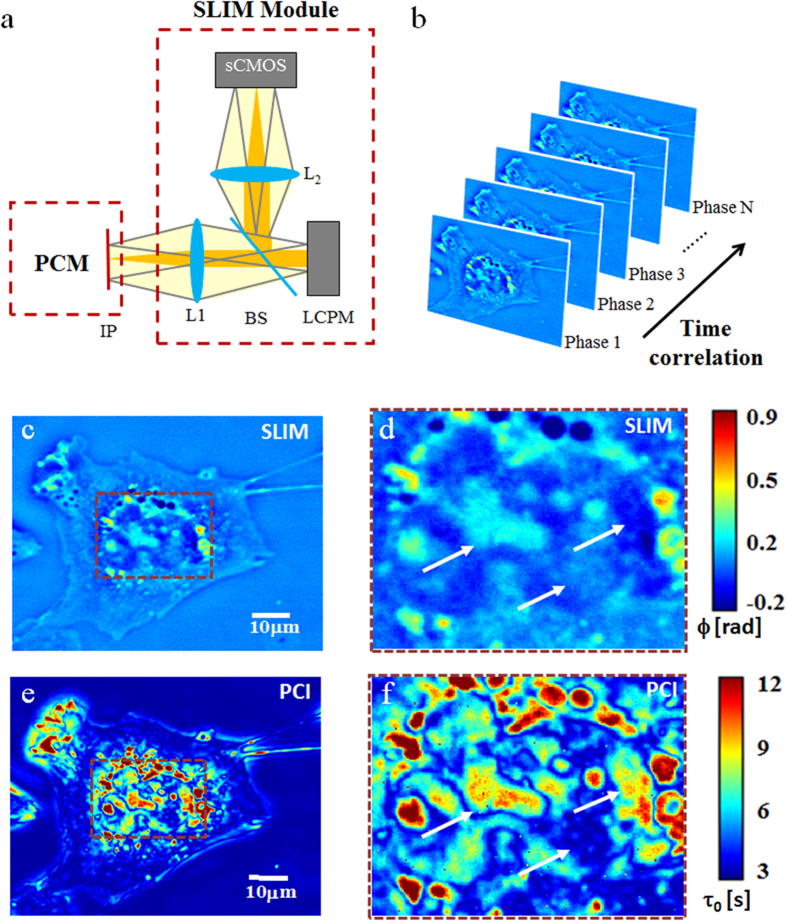
Figure 1. Generation of PCI maps.
(a) SLIM module, attached to a phase contrast microscope (PCM): L1, L2, lenses, LCPM, liquid crystal phase modulator, sCMOS, complementary metal–oxide–semiconductor camera. (b) Schematic for generation of phase correlation image by calculating the correlation time at each pixel for a sequence of time-resolved phase images. (c) SLIM image of an A549 lung cancer cells. (d) Zoomed-in view of the cellular highlighted in c. (e) PCI map for the A549 ling cell in c. (f) PCI map corresponding to the intracellular region highlighted in e.

