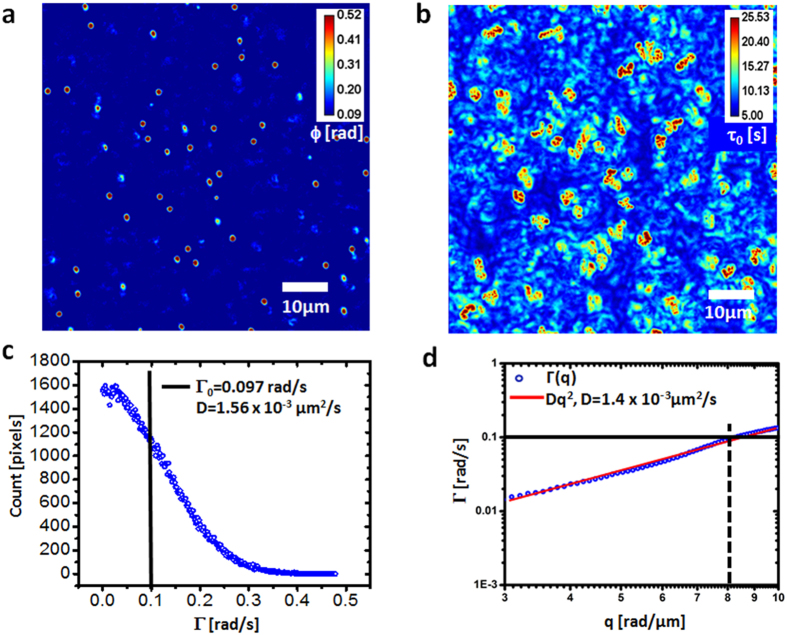
Figure 2. Measurement of diffusion coefficients of Brownian particles using PCI.
(a) Quantitative phase image of 1 μm polystyrene beads in glycerol undergoing Brownian motion. (b) Correlation time map of the sample shown in a. (c) Histogram of the bandwidth values across the PCI map, band-passed around q0 = 8 rad/μm. The mean value is displayed using the vertical line. (d) Dispersion relation curve associated with the diffusive particles shown in a. The mean Γ value from c is shown by the horizontal line.

