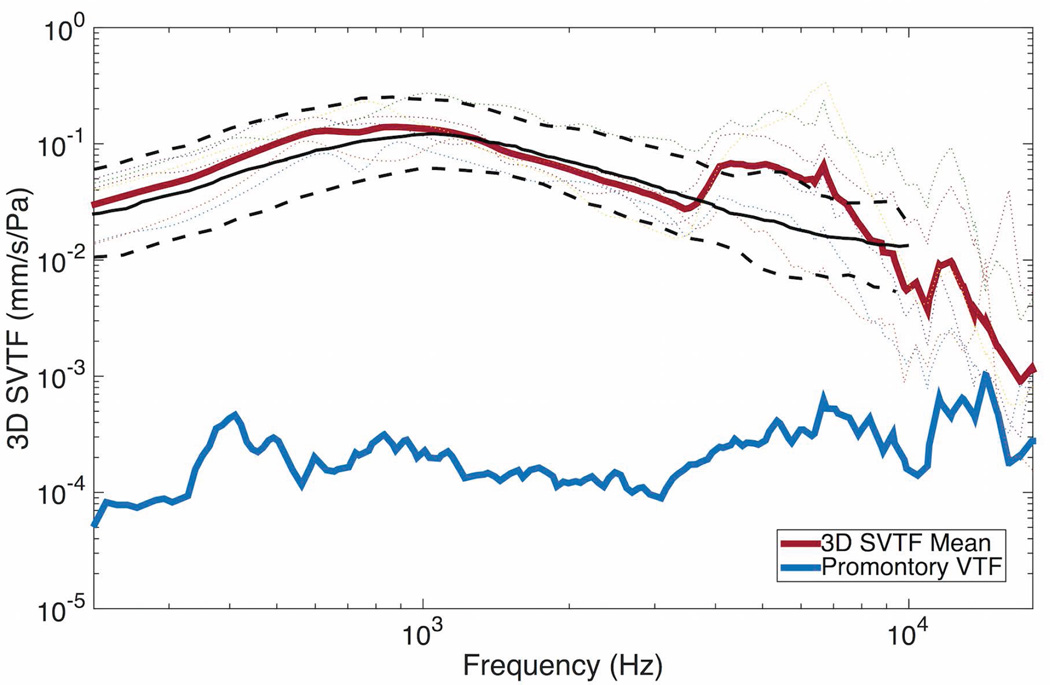
Figure 4.
Intact (baseline) 3D-SVTF. The black lines show the mean (solid) and 95% confidence interval (dashed) SVTF from the ASTM F2504 standard. The thin dotted lines show individual specimens. The cochlear promontory velocity transfer function (VTF) is shown in blue as a measure of artifact levels.

