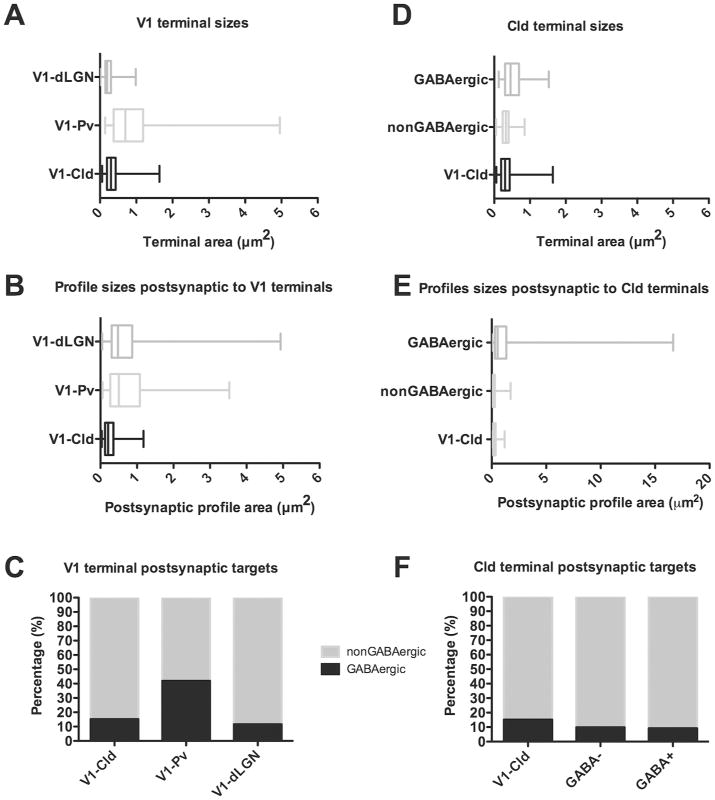
Figure 6. Quantification of circuits in the dLGN, Pv and Cld.

A) Box and whisker plots illustrate the sizes of terminals in the dLGN (n=207), Pv (n= 101) and Cld (n=189) that originate from V1. The vertical bar within each box indicates the mean terminal size, the box boundaries indicate the lower and upper quartiles (25% and 75%), and the horizontal lines (“whiskers”) indicate the full range of terminal sizes. The sizes of V1-dLGN, V1-Pv and V1-Cld terminals were significantly different from one another (Mann Whitney, p < 0.0001). B) Box and whisker plots illustrate the size of profiles postsynaptic to dLGN (n=207), Pv (n=131) and Cld (n=191) terminals that originate from V1. There was no significant difference between the size of dendrites postsynaptic to V1-dLGN and V1-Pv terminals (p = 0.7296), but dendrites postsynaptic to V1-Cld terminals were significantly smaller than dendrites postsynaptic to either V1-dLGN or V1-Pv terminals (p < 0.0001). C) Stacked histograms illustrate the percentage of GABAergic (black) and nonGABaergic (gray) profiles postsynaptic to V1-dLGN, V1-Pv and V1-Cld terminals. D) Box and whisker plots illustrate the sizes of V1-Cld terminals (n=189), the overall population of nonGABAergic terminals (n=244), and the overall population of GABAergic terminals (n=119) in the Cld. There was no significant difference between the size V1-Cld terminals and nonGABAergic terminals (p= 0.2111), but GABAergic terminals were significantly larger than both V1-Cld terminals and nonGABAergic terminals (p < 0.0001). E) Box and whisker plots illustrate the size of profiles postsynaptic V1-Cld terminals (n=191), the overall population of nonGABAergic terminals (n=244), and the overall population of GABAergic terminals (n=119) in the Cld. Profiles postsynaptic to V1-Cld terminals were significantly larger than profiles postsynaptic to nonGABAergic terminals (n = 0.0174), and dendrites postsynaptic to GABAergic terminals were significantly larger than dendrites postsynaptic to either V1-Cld or nonGABAergic terminals (p < 0.0001). F) Stacked histograms illustrate the percentage of GABAergic (black) and nonGABaergic (gray) profiles postsynaptic to V1-Cld, nonGABAergic (GABA-), and GABAergic (GABA+) terminals in the Cld.
