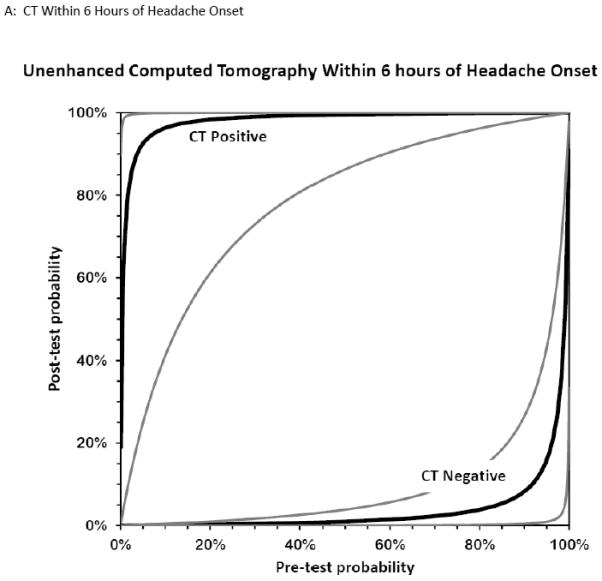
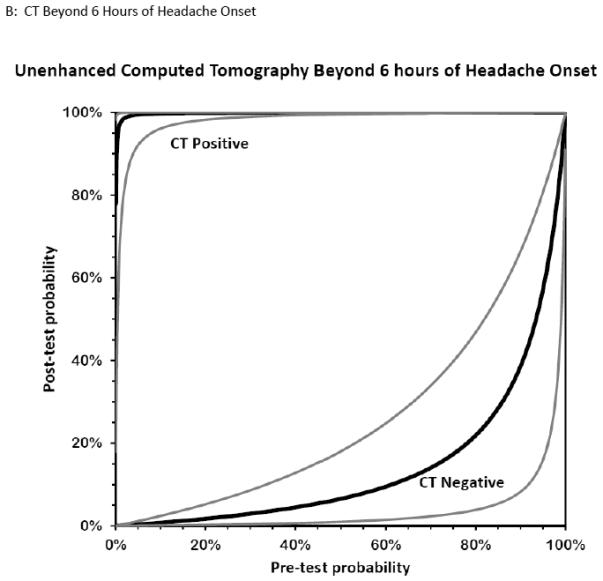
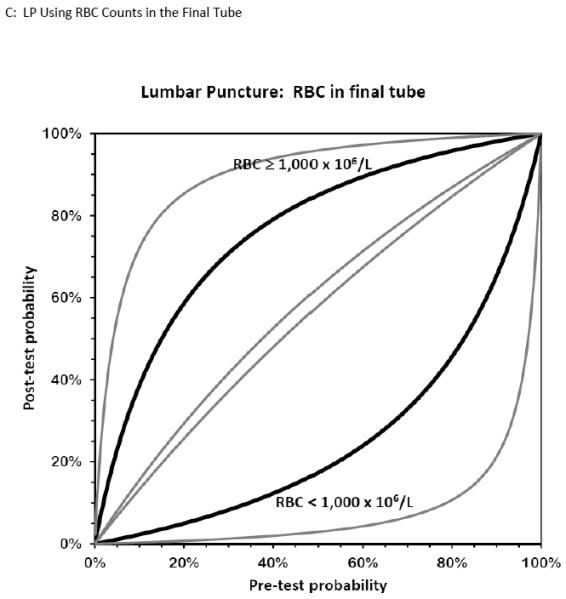
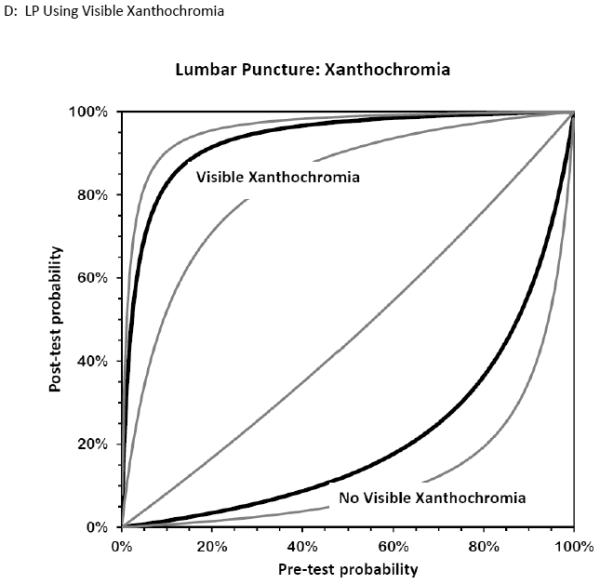
Figure 6. Bernstein Test-Indication Curves for CT and LP.


Test Indication Curves with 95% CI natural scale in panels A through D. Diagnostic accuracy of computed tomography or lumbar puncture for subarachnoid hemorrhage. Raw test-indication curves as proposed by Bernstein are shown, providing a graphical representation of the Bayesian post-test probability (y-axis) based on either a positive (upper curved black line, with 95% confidence intervals in grey) or negative (lower curved lines) test result as a function of the pre-test probability (x-axis). The graphs use the same principle as the Fagan nomogram, but provide more intuitive representations of the diagnostic accuracy of a test. The four tests considered are cranial CT obtained within 6 hours (panel A) or later (panel B) from headache onset, or LP with more than 1,000×106/L erythrocytes (panel C) or visible xanthochromia (panel D). The distance of the curves from the main diagonal of zero diagnostic information provide a visual representation of the information gained from the test result.
