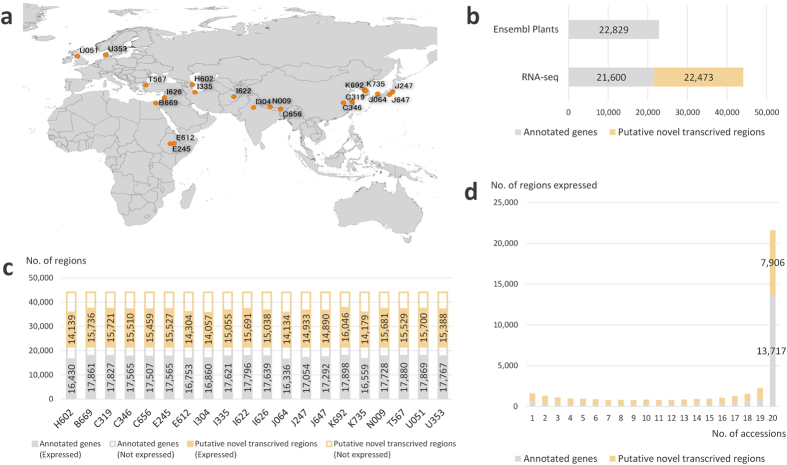
Figure 1. Barley accessions and transcribed regions identified using RNA-seq analysis.
(a) Geographic origin of the barley accessions used in this study. The origins were plotted on a map data made with Natural Earth (http://www.naturalearthdata.com/) through the QGIS 2.8.3 Wein interface (http://qgis.org/en/site/index.html). (b) Number of transcribed regions identified using RNA-seq analysis, which were compared to those annotated using the Morex genome in Ensembl Plants. (c) Number of transcribed regions expressed in each accession (FPKM ≥ 1). (d) Range of regions expressed across the 20 barley accessions.

