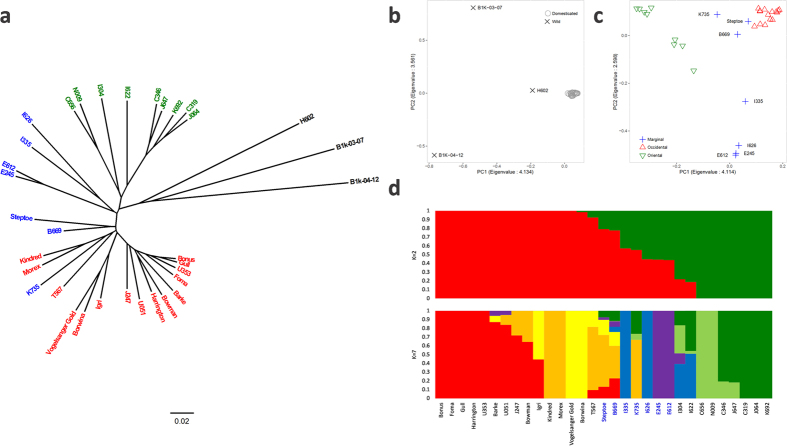
Figure 4. Molecular phylogeny and population structure according to the integrated SNPs dataset derived from RNA and exome-sequencing in barley.
The domesticated barley accessions were classified into three groups based on geographic origins: occidental (red), oriental (green), and marginal (blue). (a) Neighbour-joining tree of 34 barley accessions based on the bi-allelic SNP dataset generated using the RNA-seq and exome-sequencing datasets (Mascher et al.33). (b) PCA plot of the 31 domesticated barley accessions and three wild barley accessions. (c) PCA plot of the 31 domesticated barley accessions. (d) Bayesian clustering of the 31 domesticated barley accessions using K = 2 (upper) and K = 7 (lower) populations.

