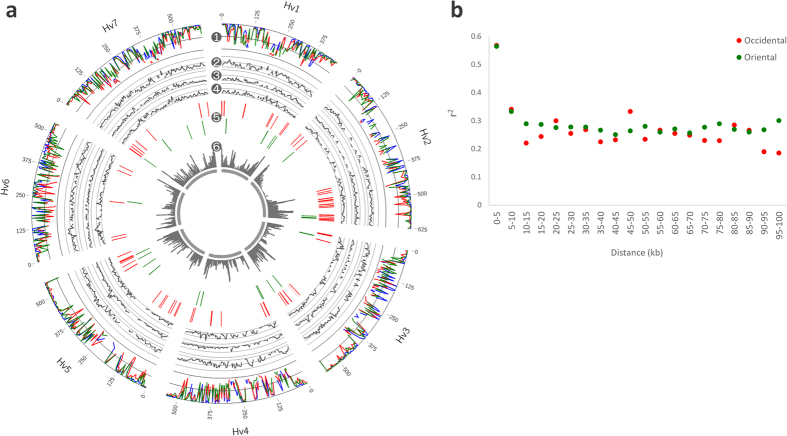
Figure 5. Overview of the genomic diversity in domesticated barley sub-populations.
(a) Genome-scale statistics and LD blocks of domesticated barley sub-populations based on the bi-allelic SNP dataset. (1) Haplotype diversity calculated for the occidental (red), oriental (green), and marginal (blue) barley populations using sliding windows of 5 million bases. (2–4) Pairwise FST values calculated for the occidental and oriental groups (2), occidental and marginal groups (3) and oriental and marginal groups (4) using sliding windows of 5 million bases. (5) LD blocks (≥10 kb) of occidental (red) and oriental (green) barley sub-populations. (6) Density distribution of transcribed regions for the integrated dataset comprising annotated genes and the putative novel transcribed regions identified in the RNA-seq analysis. (b) LD decay plots for the occidental (red) and oriental (green) barley sub-populations. The average r2 values were plotted against physical distance.

