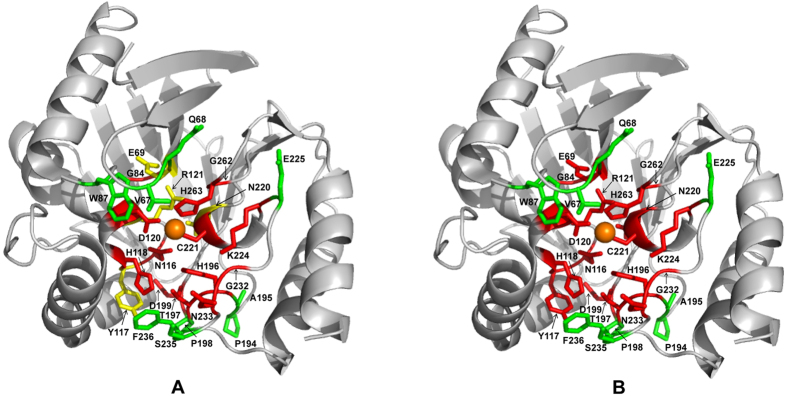
Figure 4. Diagram of the CphA β-lactamase structure showing the location of residue positions randomized in this study.
(A) Group 1, 2, and 3 residues are labeled red, yellow, and green, respectively, while the zinc atom is represented as an orange sphere. (B) Active site residues are colored according to whether positions can tolerate substitutions and retain wild-type levels of CphA function. For residues shown in red, amino acid substitutions reduce enzyme activity relative to wild type. Residues shown in green can be substituted and retain wild type levels of function. The figure was rendered with the Pymol program using coordinates from the Protein Data Bank accession code 1X8G 7.

