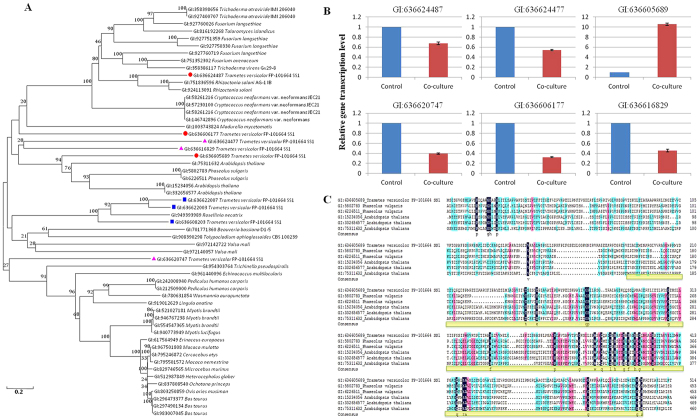
Figure 6. Bioinformatics predicts possible xylosyltransferase in T. versicolor.
(A) Phylogenetic diversity of the potential xylosyltransferases from T. versicolor and the objective ones from NCBI database. Predicted T. versicolor xylosyltransferases are highlight in color symbols. Red circle means very likely; pink triangle means likely; Blue square means less likely. Numbers within the tree indicate the occurrence (%) of the branching order 1,000 bootstrapped trees, with a value range between 20 and 100; (B) Comparison of the transcriptional levels of predicted xylosyltransferases between the co-culture and mono-culture of T. versicolor. The average value for the control (i.e. mono-culture of T. versicolor) was set to 1. Data show the mean with error bars indicating standard deviation calculated from three independent biological replicates. (C) Conserved sequence analysis of potential xylosyltransferases (GI:636605689) in T. versicolor. Conservation of residues is denoted by colors: amino acids on dark blue background are strictly conserved; amino acids on pink background are high in similarity, while those on light blue are over than 50% of similarity. Yellow line indicates glycosyltransferase_GTB_type superfamily.

