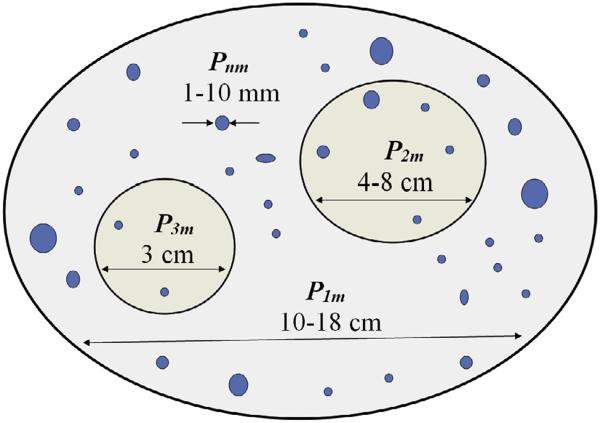
Fig. 2.
Internally synchronized cortical source regions are shown for an idealized (unfolded) cortical surface. The P symbols represent meso-scale sources, that is, current dipoles per unit volume (μA/cm2) defined at the mm scale of cortical macrocolumns by integrating over 1011 or so micro-scale synaptic sources in each column (Nunez and Srinivasan, 2006). Meso-scale sources within each region are assumed to oscillate approximately in phase. Source regions may or may not be active at the same time, and they generally oscillate at different frequencies. The illustrated diameters of the synchronous source regions (dipole layers) have the following significance: Region P1m represents the approximate size of maximum sensitivity of an unprocessed scalp recording. Scalp potentials due to constant magnitude oscillations P will progressively increase with synchronized region size up to this maximum; still larger size increases result in lower scalp potentials. P2m represents the size of maximum sensitivity of high resolution EEG (Laplacian or dura image). P3m represents the approximate minimum sized synchronized region that can be recorded on the scalp without averaging (the neurologist's rule of thumb is 6 cm2). In addition the multiple mm scale synchronous regions Pnm shown in blue represent cortical sources that are invisible at the scalp without averaging. Such small scale sources (e.g., local alpha or gamma oscillations) could easily dominate ECoG recordings such that the large scale source regions recorded at the scalp (e.g., global alpha) are strongly suppressed in the ECoG.

