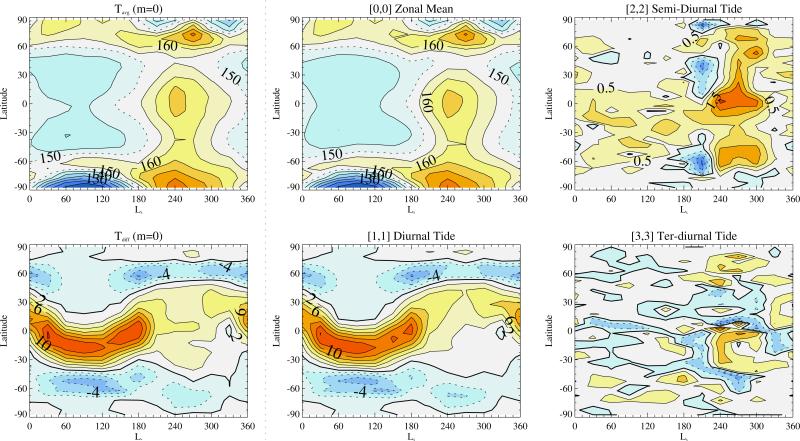
Figure 14.
M=0 local time wavenumber: (top row, left to right) Tavg calculated from the 3pm and 3am values, zonal and time mean magnitude calculated by Fourier Transform (FFT) of the full field, sun-synchronous semi-diurnal tide amplitude calculated by FFT. Contour intervals are 5K, 5K, 0.5K. (bottom row, left to right) Tdiff calculated from the 3pm and 3am values, sun–synchronous diurnal tide magnitude calculated by FFT, sun–synchronous ter-diurnal tide magnitude calculated by FFT. Contour intervals are 2K, 2K, 0.25K. All of the data are from the simulation, taken on the 2Pa layer.

