FIGURE 1.

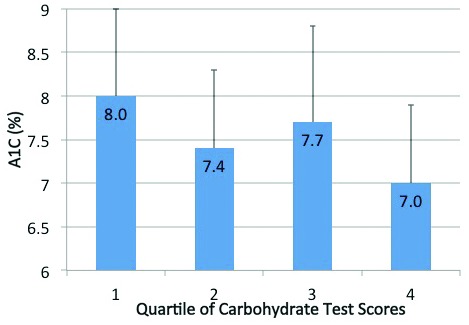
A1C (mean ± SD) by quartiles (Q) of carbohydrate test scores. The A1C of patients with the highest test scores (Q4) was lower than the A1C of patients with lower test scores (Q1), but did not reach statistical significance.

A1C (mean ± SD) by quartiles (Q) of carbohydrate test scores. The A1C of patients with the highest test scores (Q4) was lower than the A1C of patients with lower test scores (Q1), but did not reach statistical significance.