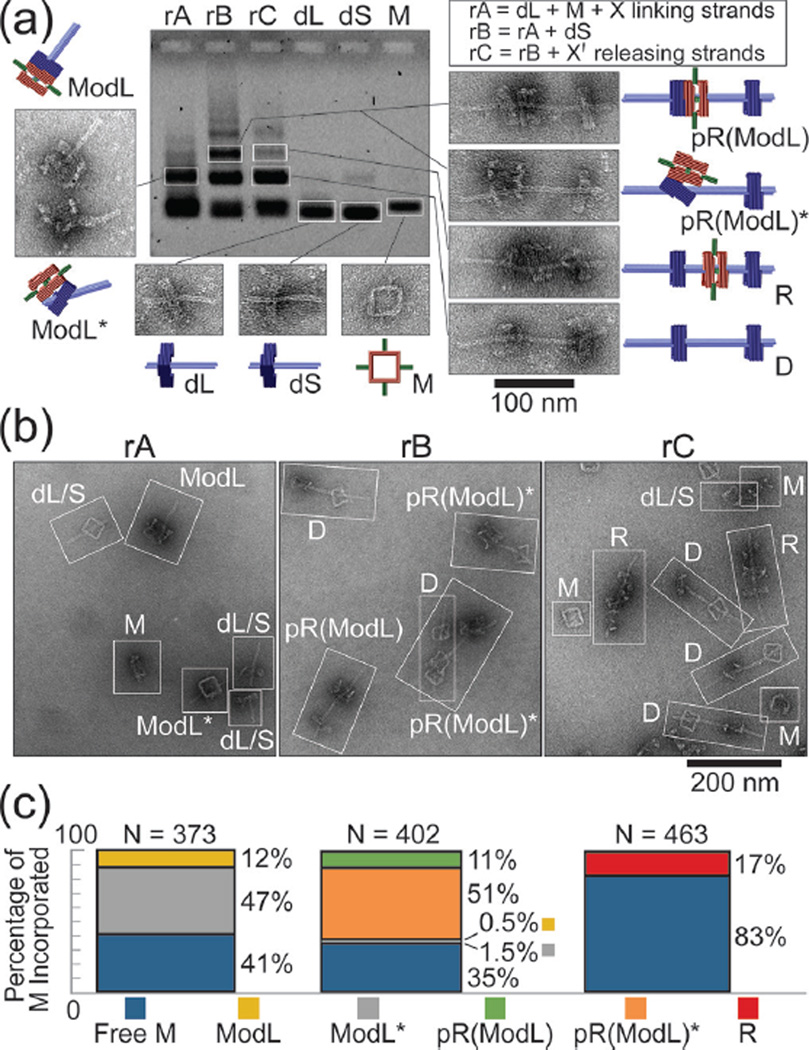
Figure 2.
DNA origami rotaxane assembly products. (a) Agarose gel electrophoresis showing individual assembly components and reaction mixtures after each assembly step. The reactants of each assembly step (rA, rB, and rC) are listed in a box on the top right corner. Representative close-up TEM images of the extracted bands of interest are shown with cartoon models. (b) Representative zoom-out TEM images of the unpurified reaction mixtures. Each distinguishable nanostructure is identified and labeled with an abbreviation. (c) Macrocycle incorporation efficiency after each reaction step presented as a bar-graph. Stacked bars from left to right correspond to rA, rB, and rC, respectively.

