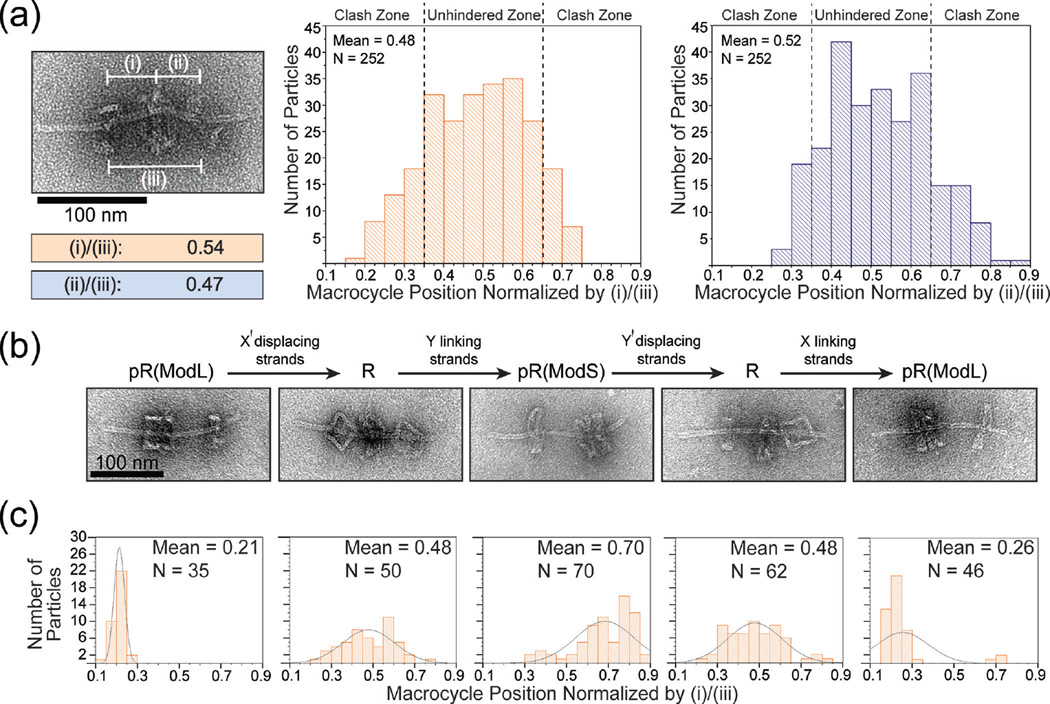
Figure 3.
The movement and switching of macrocycles in DNA origami rotaxanes. (a) Distribution of macrocycle positions with respect to stoppers. Left: a close-up TEM image and normalized measurements of macrocycle position of an example rotaxane. Center and right: normalized macrocycle positions plotted as histograms; note that although the two histograms are based on the same TEM images, they are not perfect mirror images due to slight bending of the rotaxane axles. (b) Top: scheme of displacing or linking strands induced rotaxane structural switching. Bottom: close-up TEM images of desired products. (c) The distributions of macrocycle position resulting from switching operations. Histograms correspond to the switching states in (b). Overlayed curves are included only to guide the reader’s eye.

