
FIG 2.
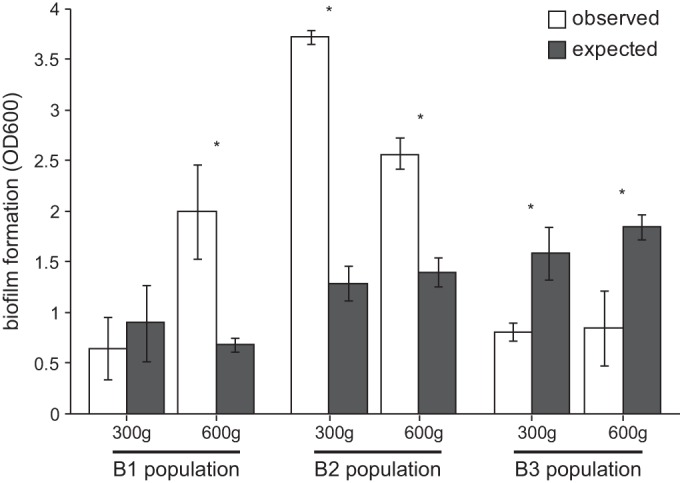
Observed and expected biomasses of evolved populations at two time points. Biofilm formation was measured by crystal violet assays for clones and mixed populations after 300 and 600 generations. The expected effects of mixture are the scaled sum of individual member outputs. Asterisks denote significant differences between observed and expected values within populations, according to post hoc Bonferroni comparisons following two-way analysis of variance (ANOVA) (P < 0.05). OD600, optical density at 600 nm.