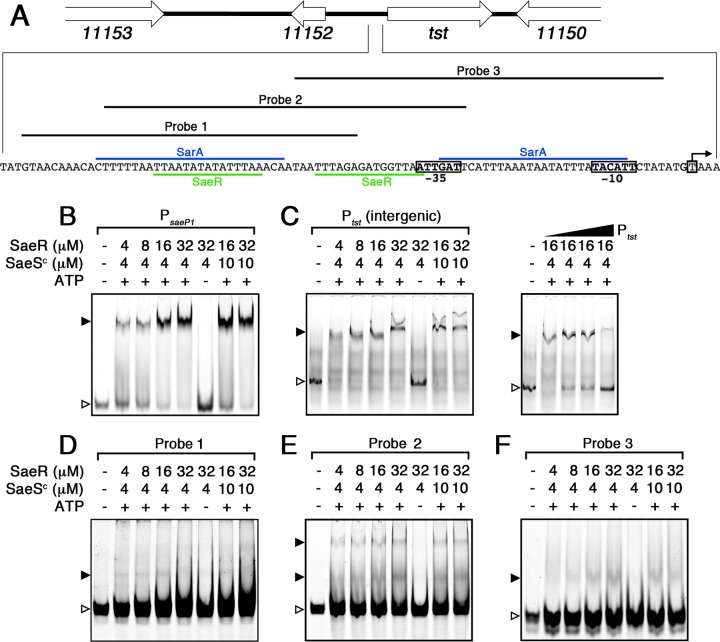
FIG 5.
DNA binding analysis of phosphorylated SaeR (P∼SaeR) to the PsaeP1 and Ptst promoters. (A) Schematic map and nucleotide sequence of Ptst in S. aureus MN8 (locus tag prefix HMPREF0769). The characterized transcriptional start site and −10 and −35 regions are labeled with boxes, and the characterized SarA binding sites is highlighted in blue (13). The proposed SaeR binding sequences are highlighted in green. Probes 1, 2, and 3 correspond to the EMSAs shown in panels D, E, and F, respectively. (C to F) DNA binding analysis of P∼SaeR to PsaeP1 (B), Ptst (C), probe 1 (D), probe 2 (E), and probe 3 (F). Panel C (right panel) also shows a competitive binding analysis using 0-, 5-, 10-, and 50-fold excess unlabeled Ptst (gradient denoted by the triangle). Unbound DNA probes are indicated by open arrowheads, and DNA shifts are indicated by solid arrowheads. Protein concentrations, and the presence of ATP in the reaction buffer, are indicated for each lane.

