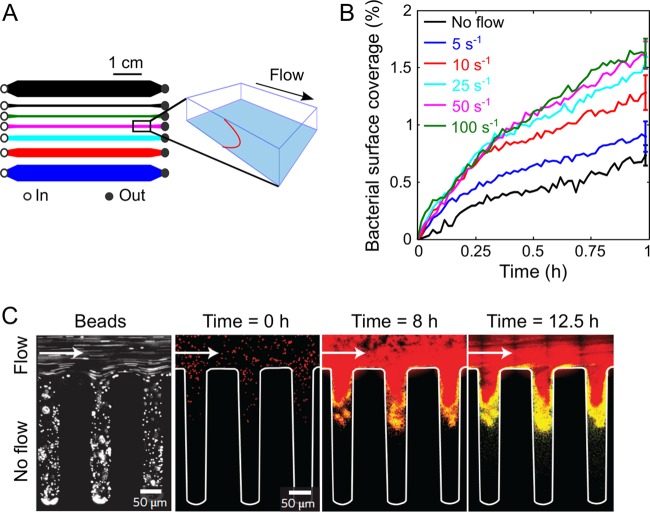
FIG 2.
Effect of flow on bacterial attachment and biofilm formation. (A) Schematic layout of the 7-channel microfluidic device (left) used to measure the effect of shear on bacterial surface attachment at 5 different shear rates simultaneously (plus two no-shear controls) and perspective view (right) of the imaging plane (blue, lower glass surface of the channel) and the parabolic flow profile (red, vertical). (Modified from reference 29.) (B) Time series of the area coverage of P. aeruginosa PA14 on an untreated glass surface for different shear rates. Each curve represents the mean of the results from 5 replicate experiments performed under identical conditions and normalized by the mean bacterial surface coverage after 1 h of flow. (Modified from reference 29.) (C) Image of fluorescent 1-μm-diameter beads flowing into a microfluidic channel with a side groove under a flow rate of 1 μl min−1 (left) and merged images of S. aureus in the same channel (right). Red, QS-off cells; yellow, QS-on cells. (Modified from reference 25 with permission of the publisher.)

