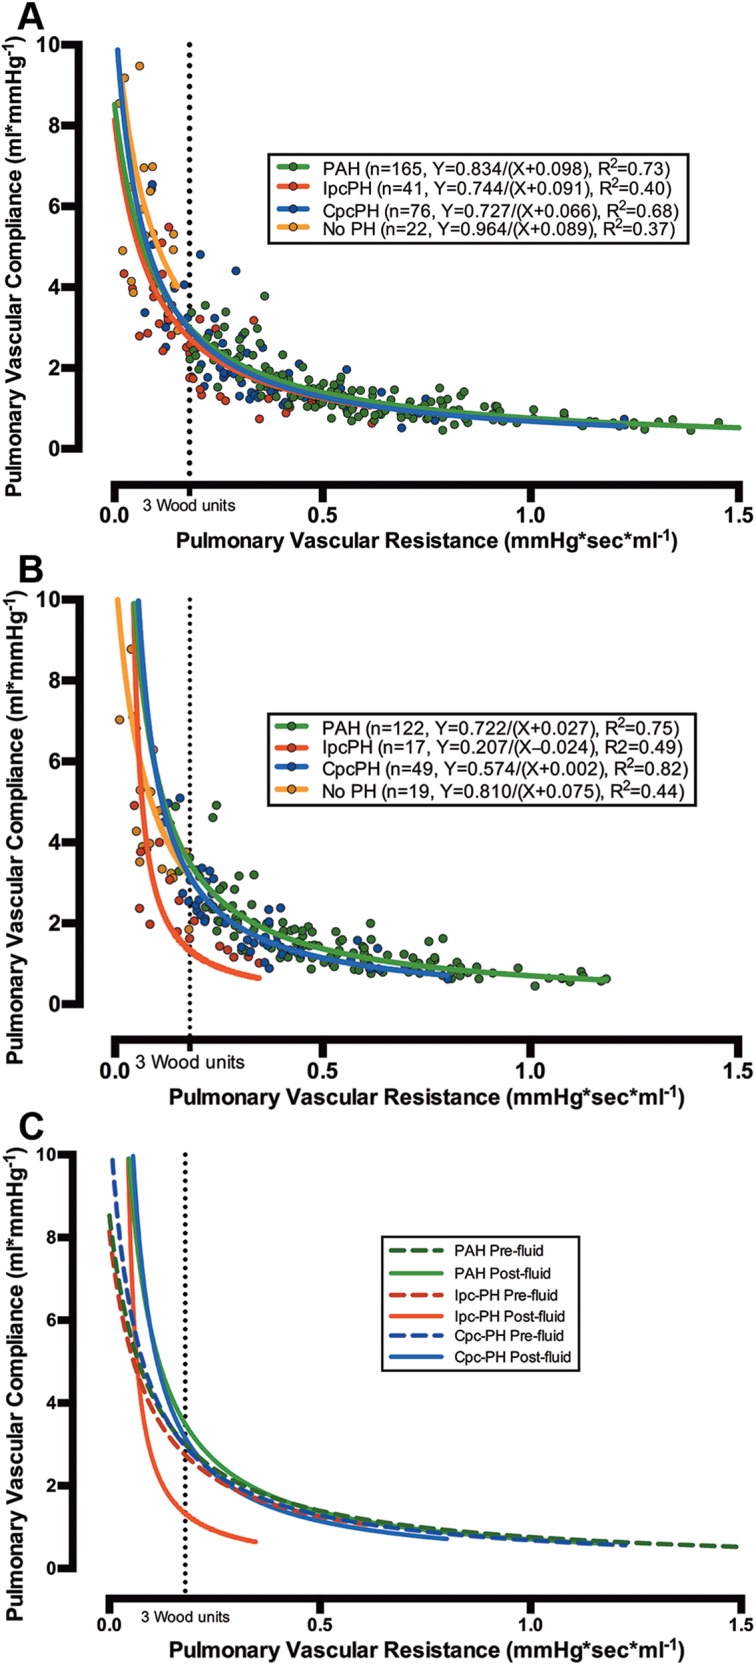
Figure 2.

Relationship of pulmonary vascular resistance (PVR) and compliance (PVC) in combined postcapillary and precapillary pulmonary hypertension (CpcPH) and pulmonary arterial hypertension (PAH), as distinct from isolated postcapillary pulmonary hypertension (IpcPH), following fluid challenge in cohort A. The X-Y scatter plots of PVC versus PVR for patients in cohort A at rest (303 patients; A) and after fluid challenge (207 patients; B) are shown (colored circles). The data were modeled with a nonlinear inverse regression with offset (bold lines in all plots). The curve for patients with IpcPH was displaced to the left after fluid challenge and did not change for patients with PAH and CpcPH (B, C). The dotted line represents 3 Wood units.
