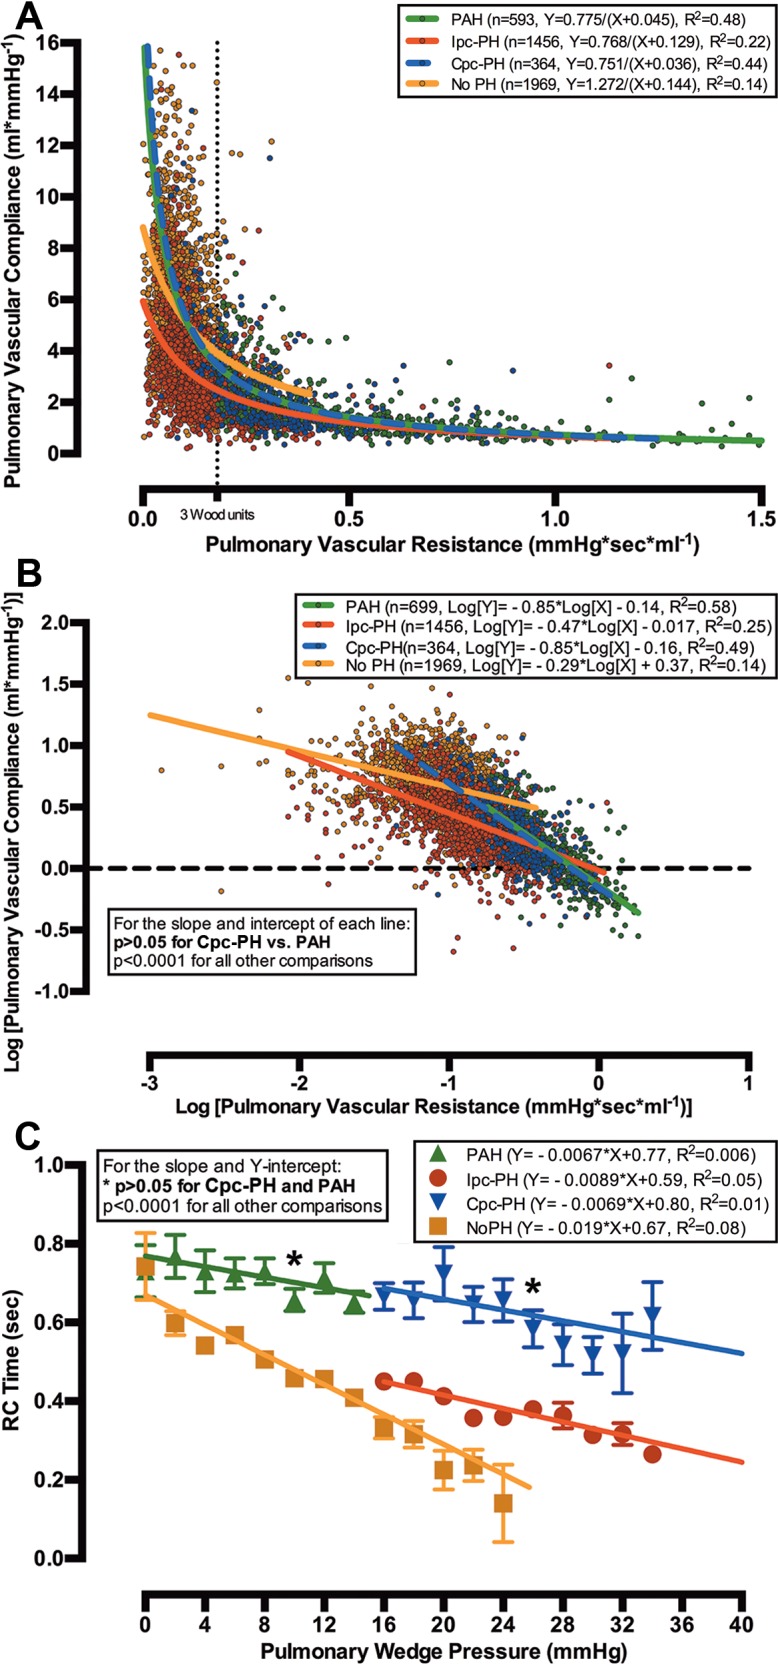
Figure 3.

Relationships of pulmonary vascular resistance (PVR) and compliance (PVC) and of resistance-compliance (RC) time and pulmonary wedge pressure (PWP) in combined postcapillary and precapillary pulmonary hypertension (Cpc-PH) and pulmonary arterial hypertension (PAH) are similar in cohort B. The X-Y scatter plot of PVC versus PVR for all 4,382 patients in cohort B (colored circles) is modeled with a nonlinear inverse regression with offset (bold lines; A). When PVR and PVC were logarithmically transformed (colored circles), the slope and Y-intercept of the linear regression (bold lines) for patients with Cpc-PH and PAH were similar (P > 0.05), and they were different from those of patients with isolated postcapillary pulmonary hypertension (Ipc-PH) or without pulmonary hypertension (No PH; B). The relationship of RC time to PWP for Cpc-PH was identical to that for PAH (P > 0.05) and distinct from that for Ipc-PH at every PWP (P < 0.0001; C).
