
FIGURE 4.
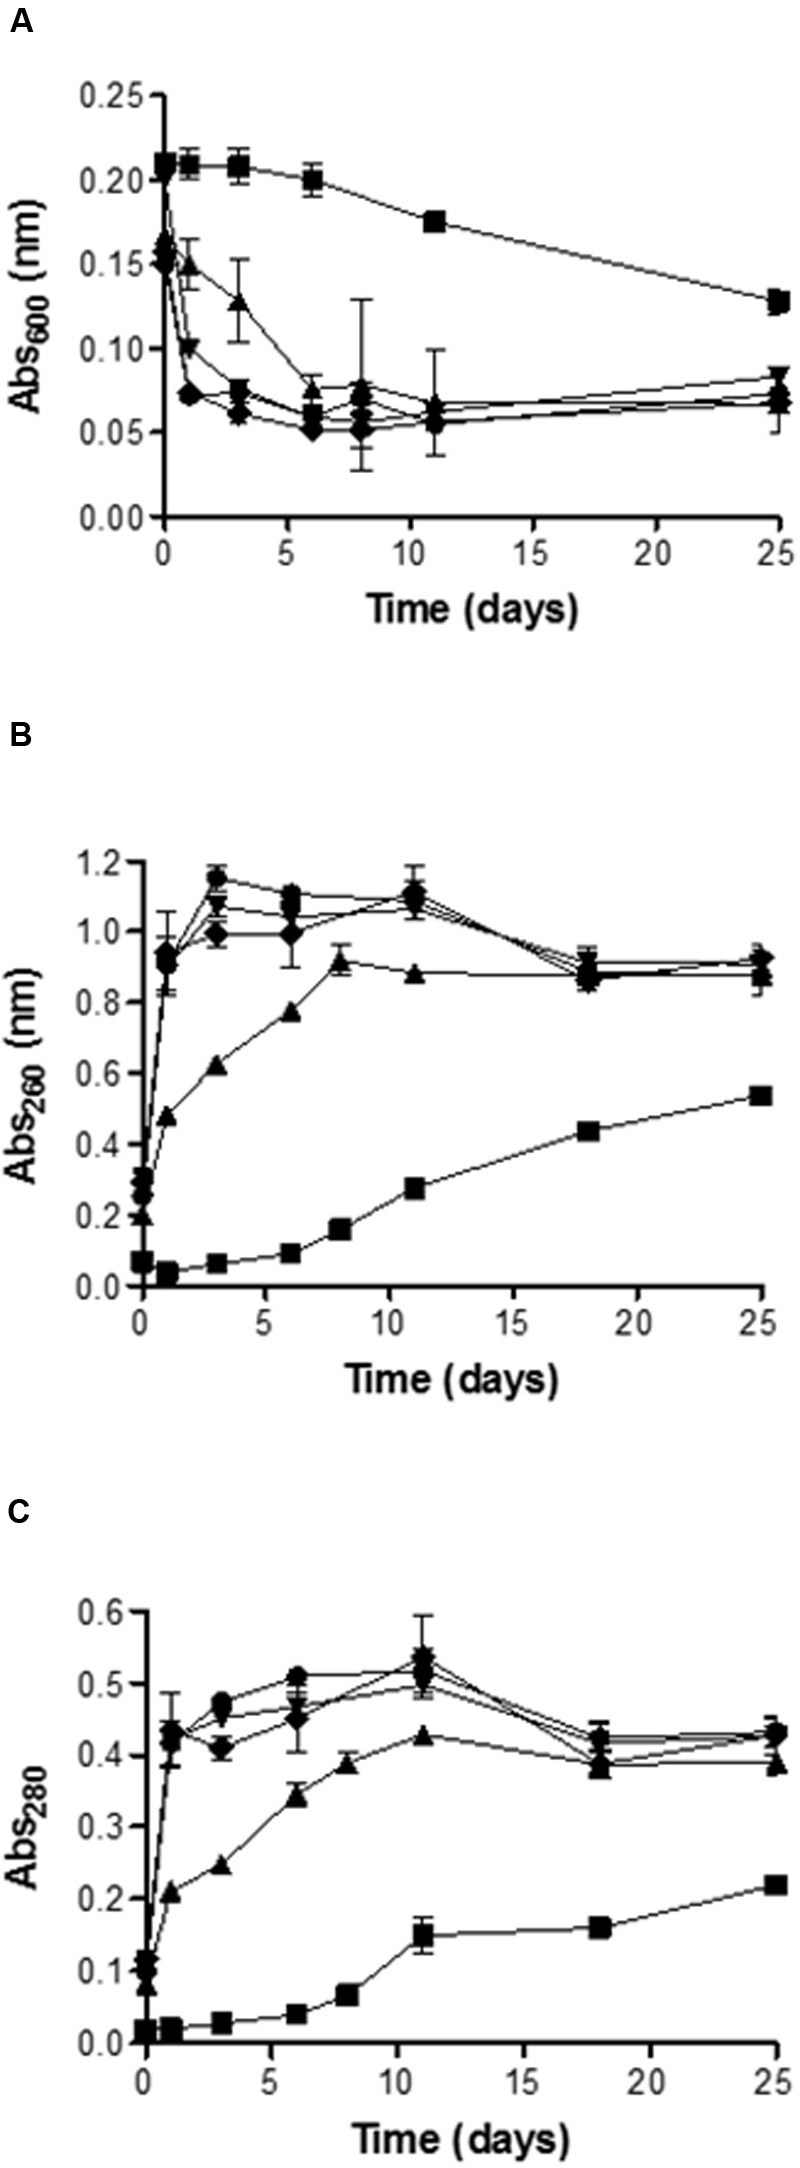
Evolution along the time of the absorbance at 600-nm (A), 260-nm (B) and 280-nm (C) of the medium containing untreated and PEF treated cells of S. cerevisiae. Untreated (▪), 15 kV/cm 45 μs (▲), 15 kV/cm 150 μs (▼), 25 kV/cm 45 μs (◆), 25 kV/cm 150 μs (●).