
FIGURE 5.
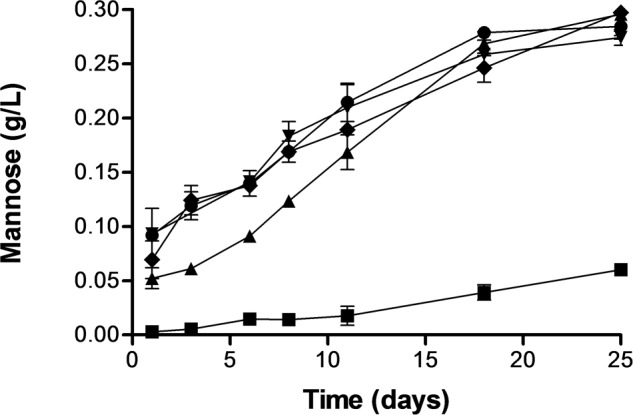
Release of mannose from S. cerevisiae cells untreated and treated by PEF treatments of different intensity. Untreated (▪), 15 kV/cm 45 μs (▲), 15 kV/cm 150 μs (▼), 25 kV/cm 45 μs (◆), 25 kV/cm 150 μs (●).
Official websites use .gov
A
.gov website belongs to an official
government organization in the United States.
Secure .gov websites use HTTPS
A lock (
) or https:// means you've safely
connected to the .gov website. Share sensitive
information only on official, secure websites.
Release of mannose from S. cerevisiae cells untreated and treated by PEF treatments of different intensity. Untreated (▪), 15 kV/cm 45 μs (▲), 15 kV/cm 150 μs (▼), 25 kV/cm 45 μs (◆), 25 kV/cm 150 μs (●).