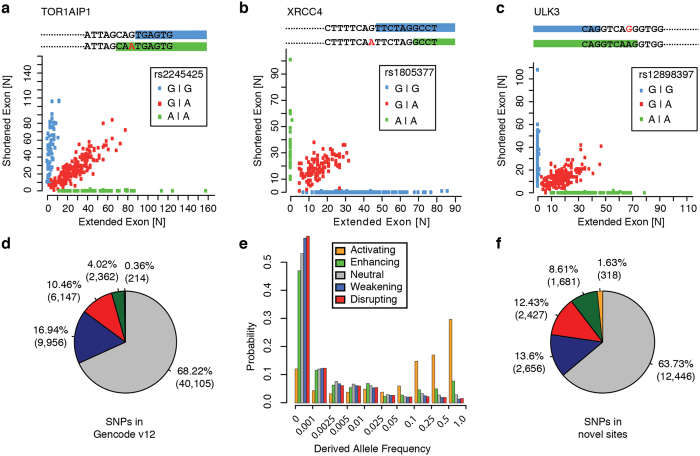
Figure 2. Distribution of different variant classes.
(a–c) Scatter plots with examples for splice site switching triggered by splice site disrupting SNPs at the flanks of coding exons. The distribution of read counts at the extended (x-axis) and the shortened (y-axis) exon boundary is reported for all individuals carrying exclusively the reference allele (green), for individuals with homozygous SNP alleles (blue), and for heterozygous individuals (red). (a) A NAGNAG tandem acceptor site (delta = 3) in the TOR1AIP1 gene, (b) alternative acceptor sites (delta = 6) in the XRCC4 gene, and (c) alternative donor sites (delta = 6) in the URK3 gene. (d) The distribution of variants that stem from DNA polymorphisms in splice sites annotated by the Gencode v12 reference, classified accordingly by the differences in predicted splice site scores into disrupting (red), weakening (blue), neutral (gray), enhancing (green), and activating (orange) variants. Most sequence variants in splice sites are predicted to be neutral, and the Gencode reference splice sites harbor many more weakening and disrupting than enhancing and activating variants. (e) Derived allele frequencies (DAFs) of variants categorized according to the five different variant classes: alleles of enhancing variants (green bars) are deviating significantly (p-value ~ 2e-4, KS test), and alleles of activating variants (orange bars) even more significantly (p-value ~ 9e-5, KS test), from the distribution of allele frequencies of neutral variants (gray bars), enriching in higher abundant alleles. Weakening (blue bars) or disrupting variants (red bars) on the contrary accumulate more in low allele frequencies than neutral variants (p-value ~ 2e-3 and p-value ~ 2e-4, KS test). (f) An analogous pie chart as shown in (d), but for variants in novel splice sites of PNIs, exhibits relatively less neutral and weakening, but more enhancing, activating, and also disrupting variants.

