
Figure 3.
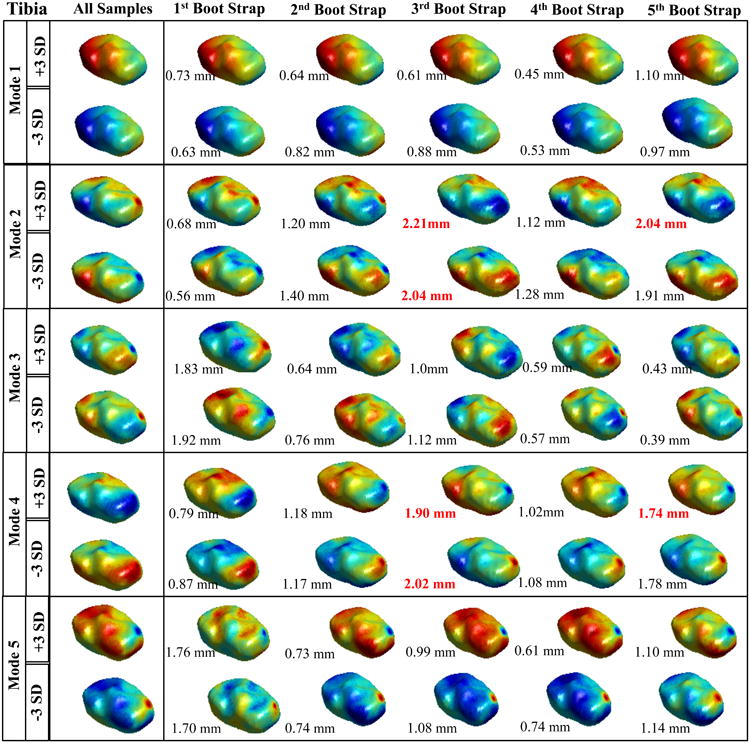
Results of the Tibia bootstrapping experiment. Spatial distribution of the vertex displacements assigned to mode values equal to: mean +3*standard deviation and mean – standard deviation. Each row represents a different modes form 1 to 5. The first column shows the model obtained with the whole cohort (119 knees). The rows 2-6 show the spatial distribution of the displacement for the different bootstrap together with the average distance between the fully sampled model.