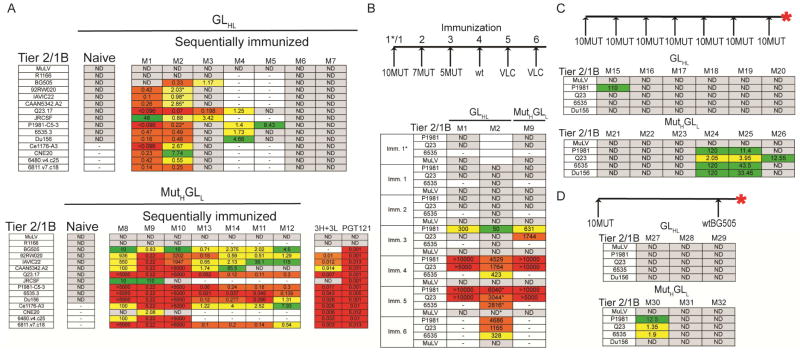
Figure 3.
Neutralization in the serum of immunized GLHL121 and MutHGLL121 knock-in mice. (A) TZM-bl neutralization activity (IC50 or 1/ID50 in mice M8 and M10) in the serum of naïve and sequentially immunized GLHL121 (M1–M7, top) and MutHGLL121 (M8–12, bottom) mice against a panel of 12 Tier 2 and 2 tier 1B HIV-1 isolates. Samples with asterisk correspond to step 5 in the immunization, all others were measured after complete protocol. The activity of the human PGT121 bNAb and the inferred intermediate 3H+3L against the same panel of viruses is shown. (B) Longitudinal analysis of the neutralization activity in the serum of sequentially immunized GLHL121 and MutHGLL121 mice. Table shows TZM-bl neutralization activity (1/ID50) against MuLV control and 3 Tier2/1B HIV-1 isolates for 1/50 dilutions of serum from 2 GLHL121 (M1–M2) and 1 MutHGLL121 (M9) mice collected after each immunization as indicated (left). Samples with an asterisk correspond to purified Igs and not serum. (C) Diagrammatic representation of the immunization protocol (top). Table shows TZM-bl neutralization activity (IC50) in the serum of GLHL121 and MutHGLL121 mice immunized 7 times with 10MUT. (D) Diagrammatic representation of the immunization protocol (top). Table shows TZM-bl neutralization activity (IC50) in the serum of GLHL121 and MutHGLL121 mice immunized with 10MUT followed by a boost with wtBG505. IC50 < 0.096 in red; 0.096- 0.5 in orange; 0.5- 4 in yellow; > 4 green; 1/ID50 > 5000 in red; 5000-1000 in orange; 1000-100 in yellow; <100 in green; not detectable (ND) in gray; not tested indicated by a dash. Red asterisk indicates the time point of analysis. See also Figure S3 and S4.

