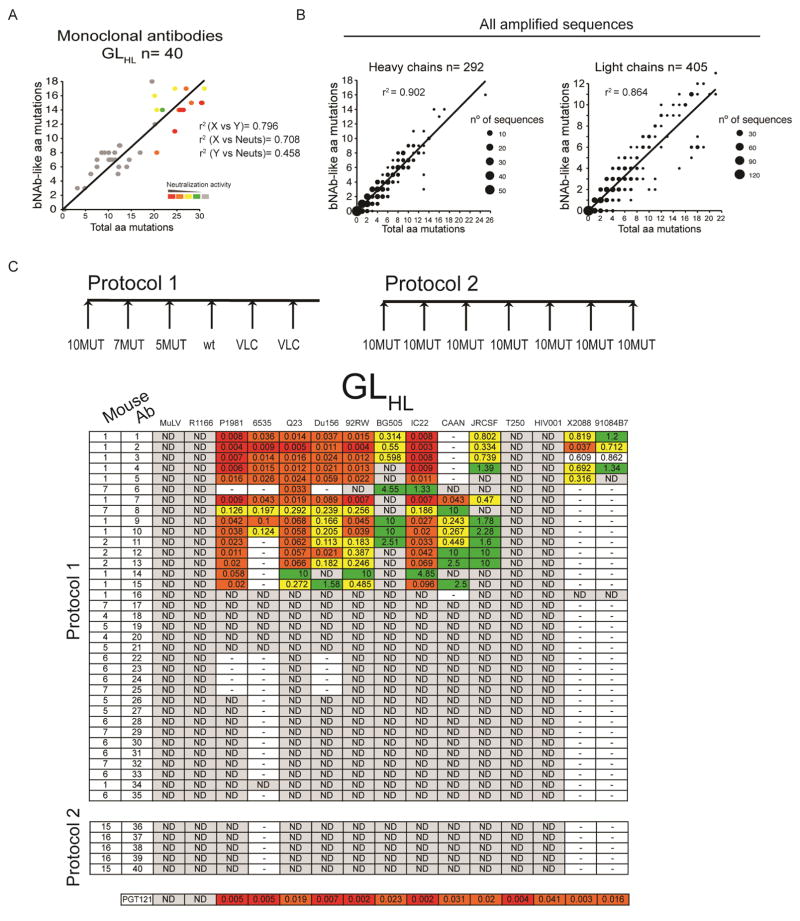
Figure 6.
Monoclonal antibody neutralizing activity. (A) 3D plot showing neutralization activity (color coded), total number of amino acid mutations (X axis) and the number of mutations that are identical or chemically equivalent to mutations in the human PGT121, PGT122, PGT123 or 10-1074 bNAbs (bNAb-like) (Y axis) for all monoclonal antibodies from GLHL121 mice immunized according to Protocol 1 and 2. Chemical equivalence is as in (B). Each antibody was assigned a neutralization score (see Materials and Methods). Red indicates higher neutralization scores. Correlation coefficients (r2) are indicated. r2 (X vs. Y) refers to the correlation between total amino acid mutations and the number of bNAb-like mutations; r2 (X vs. Neut) refers to the correlation between total amino acid mutations and neutralization score: r2 (Y vs. Neut) refers to the correlation between bNAb-like mutations and neutralization score. (B) Graphs show the total number of amino acid mutations (X axis) in IgH (left) and IgL (right) of all antibody sequences from GLHL121 mice immunized with protocols 1, 2 or 3 vs. the number of mutations that are identical or chemically equivalent to mutations in the human PGT121, PGT122, PGT123 or 10-1074 bNAbs (bNAb-like) (Y axis). 292 and 405 IgH and IgL sequences respectively were analyzed. The size of the dot is proportional to the number of sequences. Chemical equivalence was as follows: Group 1: G/A/V/L/I; Group 2: S/T; Group 3: C/M; Group 4: D/N/E/Q; Group 5: R/K/H; Group 6: F/Y/W; Group 7: P. Correlation coefficient (r2) is indicated. (C) Table shows the results of TZM-bl assays on monoclonal antibodies from GLHL121 mice immunized according to Protocol 1 and 2 as indicated in the diagrams on top. The protocol, mouse, antibody name, and the 14 tier 2/1B HIV-1 isolates are indicated at left and top respectively. Neutralization activity code: IC50 <0.01 in red; 0.01–0.1 in orange; 0.1–1 in yellow; >1 in green; not detectable (ND) in gray; not tested indicated by a dash. See also Figure S6.

