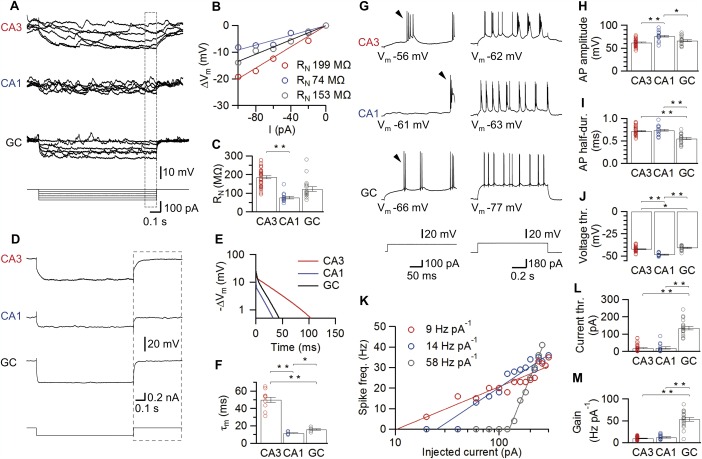
Figure 4.

Passive and active membrane properties of hippocampal principal neurons in vivo. A–C: Assessment of input resistance (R N). Typical membrane potential traces (A) in response to 1‐s current pulses for a CA3 pyramidal neuron, a CA1 pyramidal neuron, and a dentate gyrus GC and voltage‐current relations (B) for the respective neurons. The voltage change was quantified from the last 100 ms of the stimulus (box in A). Summary bar graphs of input resistance for all cell types (C) demonstrate that input resistance is highest in CA3 pyramidal neurons. D–F: Calculation of the membrane time constant (τ m). Average membrane potential traces for three representative neurons in response to 1‐s hyperpolarizing current pulses (−200 pA current injection, A). The boxes in (D) indicate the analysis window after the pulse used for the semi‐logarithmic plots of voltage changes in (E). We determined τ m as the time constant of the slow component from a biexponential fit. Summary bar graphs reveal that CA3 pyramidal neurons had the slowest τ m. G–M: Cell type‐specific active properties of hippocampal principal neurons. G: Firing pattern of hippocampal principal neurons in response to supra‐threshold current pulses. (Left, 100 pA; right, 180 pA stimulus amplitude). Arrowheads mark the first AP in the train, which was used for evaluation of evoked AP properties. Note that pyramidal neurons display bursting characteristics resembling those of early bursting CA1/subicular cells (Graves et al., 2012). H–J: Summary bar graphs of evoked AP peak amplitude (H), half‐duration (I), and voltage threshold (J). Individual examples of the resulting frequency‐current relations for three different, representative neurons (K). Lines represent a semi‐logarithmic fit with offset to the data points (Materials and Methods). Bar graphs of current threshold (L), and gain factor (M), with the latter measured as the slope of the fitted function. Note that both voltage and current threshold were lower in CA3 and CA1 pyramidal neurons than in GCs, whereas the gain was highest in GCs. Bars indicate mean ± SEM and circles represent values obtained from individual experiments.*, P < 0.05; **, P < 0.001. [Color figure can be viewed in the online issue, which is available at wileyonlinelibrary.com.]
