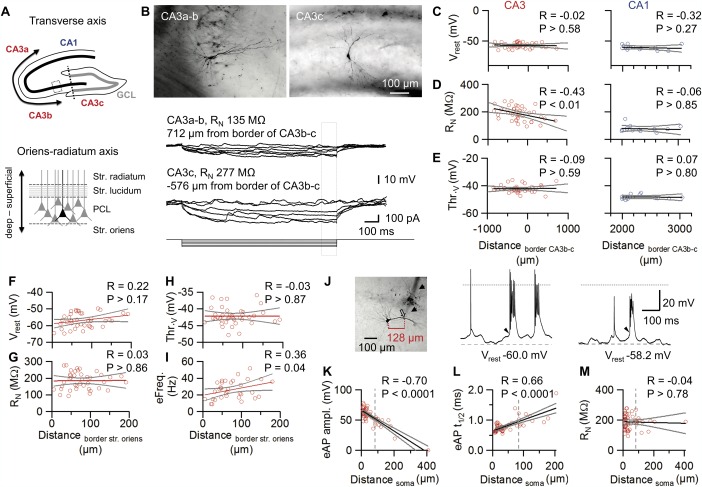
Figure 5.

Gradient of passive and active properties of CA3 pyramidal neurons along the CA3 a–c axis in vivo. A: Schematic representation of the transverse CA3a–c axis (top; transverse axis, bidirectional arrow) and the CA3 radial axis in the principal cell layer (PCL; bottom; Oriens‐ratiatum axis, bidirectional arrow). In top, the CA3b–c boundary is represented as dotted line while the inset box illustrates the CA3 PCL region displayed at the bottom. B: Top, extended focal images of representative CA3 pyramidal neurons recorded at middle‐distal CA3 (CA3a–b; left) and proximal CA3 (CA3c; right) pyramidal areas. Bottom, corresponding V m traces in response to 1‐s current pulses (0 to −100 pA). Note the higher input resistance of the CA3c neurons. C–E: Scatter plots of V rest (C), RN (D), and voltage threshold (E) versus somatic position, measured from the CA3b–c boundary. The CA3 cells (n = 41; left) are compared to CA1 cells (n = 13; right). Positive values correspond to the middle‐distal CA3 region, whereas negative values correspond to the proximal CA3. Note that most of the recordings were performed in the middle and proximal CA3 regions (Li et al., 1994). Distances were measured along the pyramidal cell layer (A top). Gray lines indicate 95% confidence intervals. F–I: Scatter plots of V rest (F), R N (G), voltage threshold (Thr.v; H), and evoked firing frequency by 200 pA injected current (eFreq; I) versus somatic position from the deep border of the PCL (A bottom). J: Extended focal image of a CA3 pyramidal neuron in a putative dendritic recording. Note the prominent patch‐pipette track (arrows) as well as the dendritic bead caused by patch pipette removal (open arrow, distance from center of soma indicated in red). Whole‐cell patch‐clamp recordings of spontaneous firing recorded at a soma (middle) and at a dendrite (right). Dashed lines indicate resting potential, dotted lines represent V m = 0. Note that APs are overshooting in the somatic recording, but nonovershooting in the dendritic recording. Additionally, the amplitude of the underlying depolarizing envelope (arrowheads) is enhanced in the dendrite. K–M: Scatter plots of peak amplitude (K), half‐duration (t 1/2, L), and R N (M) of evoked APs (eAP) vs. distance from center of soma. APs were evoked by depolarizing current injection. Spearman's rank correlation coefficient and P values are indicated on top of each panel. Dashed line indicates separation criterion for < 80 µm (classified as somatic recording) and ≥ 80 µm (classified as dendritic recording), gray lines indicate 95% confidence intervals. [Color figure can be viewed in the online issue, which is available at wileyonlinelibrary.com.]
