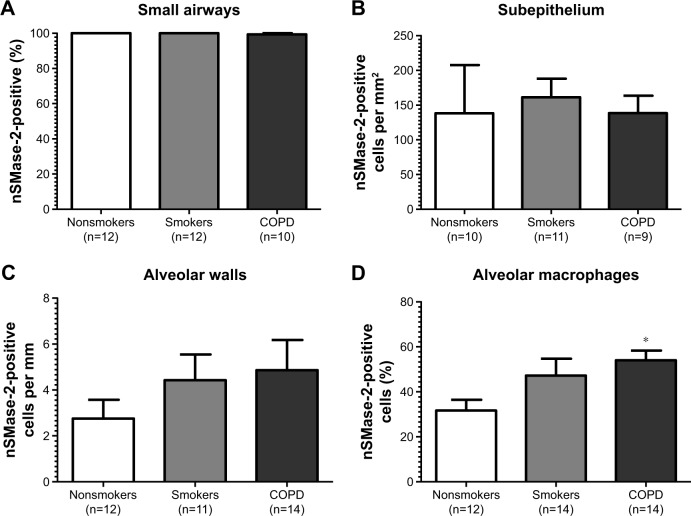
Figure 2.
Quantification of nSMase-2 in lung tissue.
Notes: All data are presented in graphs as means and standard errors of the mean. (A) The percentages of intact small airways with nSMase-2 labeling, (B) the number of cells with nSMase-2 labeling per mm2 of the subepithelium, (C) the number of cells with nSMase-2 labeling per mm of the alveolar wall, and (D) the percentage of alveolar macrophages with nSMase-2 labeling. *P<0.05 according to Dunnett’s multiple comparison test.

