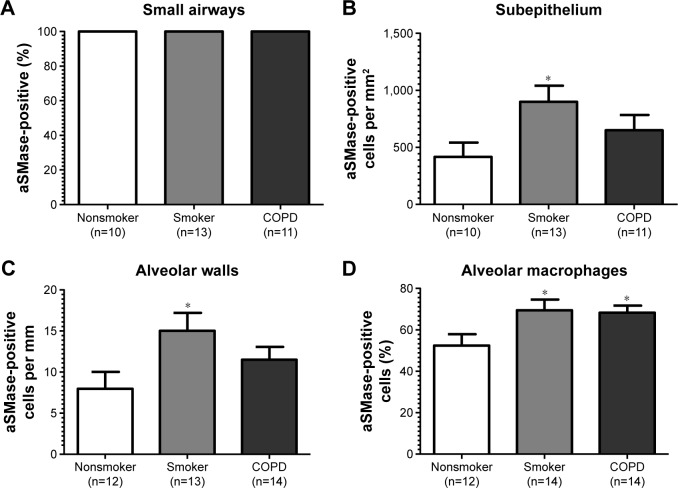
Figure 4.
Quantification of aSMase labeling in lung.
Notes: All data are presented in graphs as means and standard errors of the mean. (A) The percentages of intact small airways with aSMase labeling, (B) the number of cells with aSMase labeling per mm2 of the subepithelium, (C) the number of cells with aSMase labeling per mm of the alveolar wall, and (D) the percentage of alveolar macrophages with aSMase labelling. *P<0.05 according to Dunnett’s multiple comparison test.

