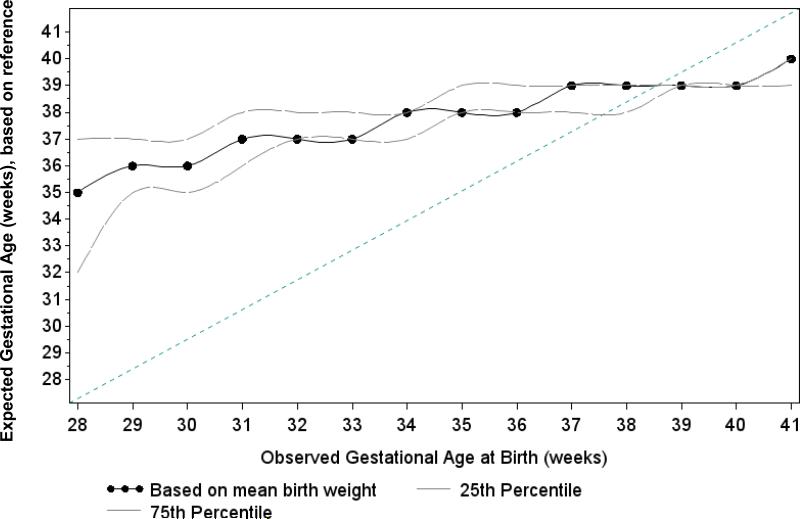
Figure 1.
Observed versus expected gestational age of 9,529 HIV-infected women in Lusaka, Zambia 2009-2013. The X-axis indicates the value of gestational age (weeks) observed in the data. To calculate expected values of gestational age (Y-axis), we compared each week of gestational age at birth to a reference curve adjusted to a Zambian population and found the smallest absolute difference in birthweight among reference curve values. The dotted line indicates expected gestational age based on mean birthweight and the dashed lines indicate expected values based on the 25th and 75th percentiles of birthweight. The diagonal line indicates perfect agreement between observed and expected values. The divergence of the dotted and dashed lines from the line of agreement at gestational ages <37 weeks) suggests that the measurement error in at these gestational ages is non-random in the direction of gestational age being incorrectly specified as too early. At gestational ages ≥37 weeks, measurement error appeared to be more randomly distributed around the line of agreement.

