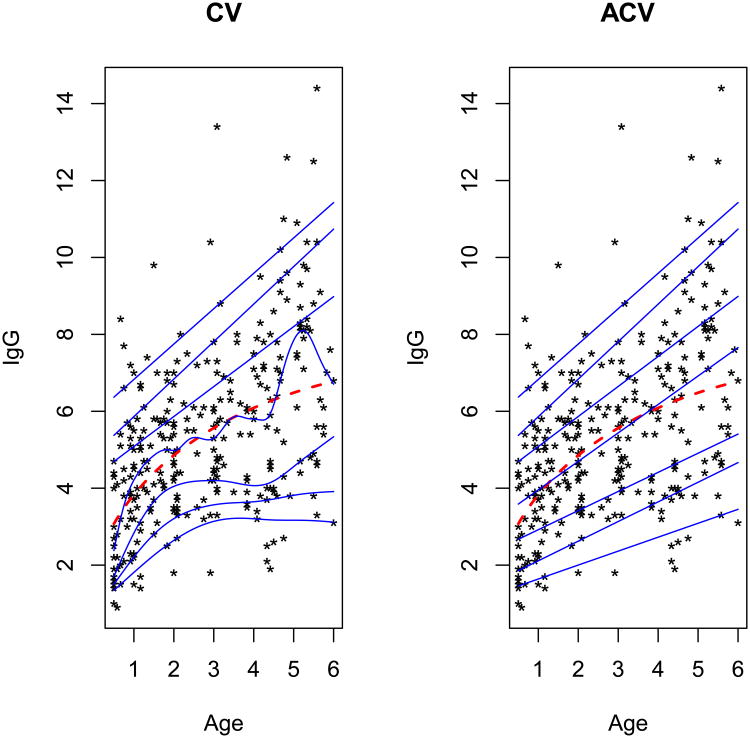
Figure 2.
Fitted quantile smoothing splines at q=0.05, 0.1, 0.25, 0.5, 0.75, 0.9, and 0.95, highlighted in blue from the bottom to the top, in the immunoglobulin-G data set. The dashed fitting line is obtained from the model given by Isaacs et al. (1983). The results of CV and ACV are shown in the left and right panels, respectively.

