
Figure 3.
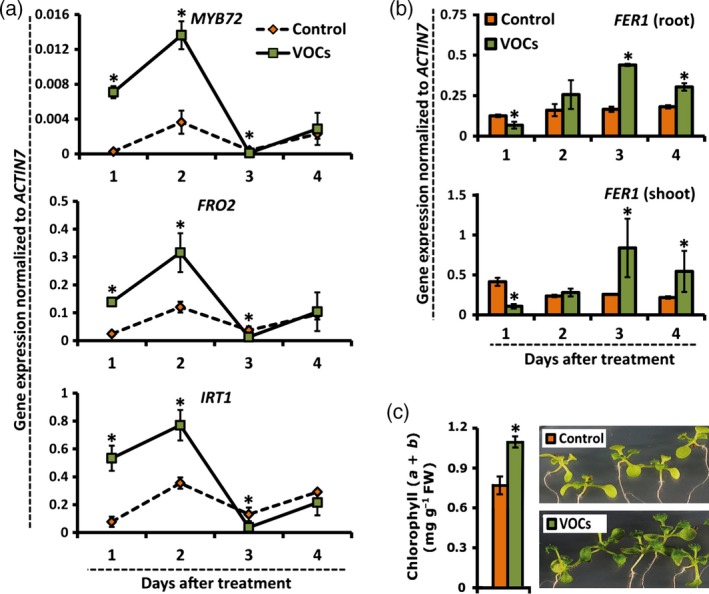
Bacterial VOCs stimulate expression of markers for improved iron nutrition.
(a,b) Kinetics of expression of MYB72,FRO2 and IRT1 (a) and FER1 (b) in the roots of mock‐treated (control) and P. simiae WCS417 VOC‐treated Arabidopsis Col‐0 seedlings as indicated by quantitative RT‐PCR analysis. Seedlings were treated in a split‐plate assay when 12 days old, and samples were collected 1, 2, 3 and 4 days after treatment. Values are means ± SD of three replicates. Asterisks indicate statistically significant differences compared with mock‐treated roots (Student's t test; P < 0.05).
(c) Chlorophyll (a + b) content and phenotypes of control and bacterial VOC‐treated seedlings grown under iron limitation (5 μm Fe(III)EDTA). Seedlings were transferred to low‐iron plates when 10 days old, and treated or not with bacterial VOCs for 9 days, after which chlorophyll content was measured. Photos were taken 5 days after VOC treatment. of three replicates alues are means ± SD of nine replicates. The asterisk indicates a statistically significant difference compared with mock‐treated seedlings (Student's t test; P < 0.05).