
Figure 5.
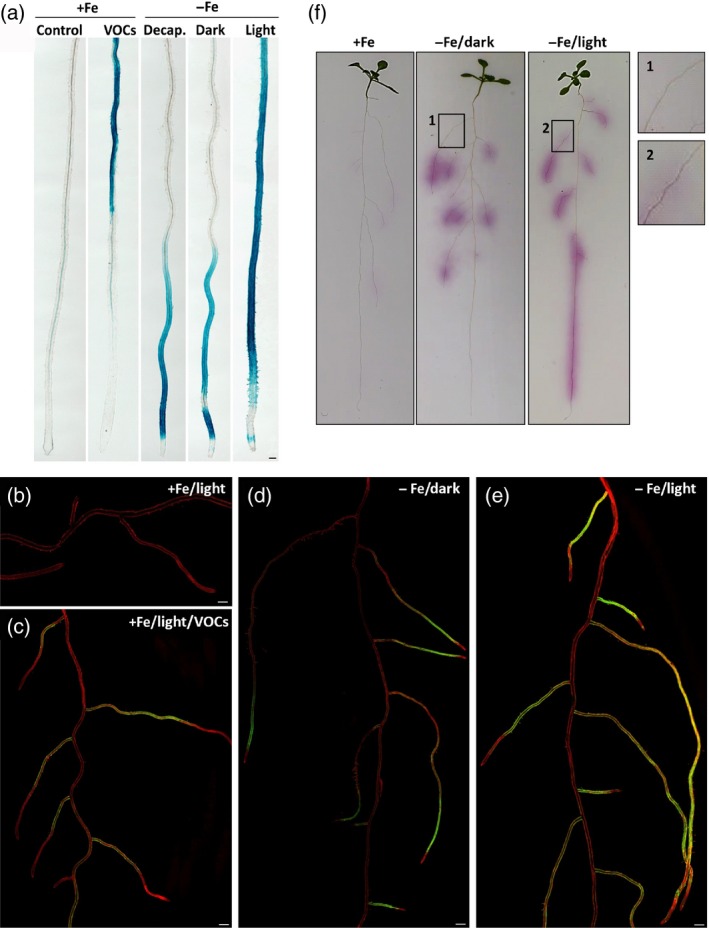
Local and systemic activation of iron‐uptake responses in Arabidopsis roots.
(a) Representative images of GUS‐stained primary roots of 2‐week‐old pMYB72:GFP‐GUS seedlings subjected to P. simiae WCS417 VOCs under standard growth conditions (+Fe) in the light, or to iron deficiency (−Fe, 300 μm Ferrozine) with decapitation (decap.), in complete darkness (dark) or under a normal photoperiod (light). GUS staining was performed 3 days after treatment. Scale bar = 50 μm.
(b–e) Representative confocal images of roots of 3‐week‐old pMYB72:GFP‐GUS seedlings growing under (b) standard conditions (+Fe, light), (c) upon exposure to WCS417 VOCs (+Fe, light, VOCs), (d) upon exposure to iron‐limited conditions and complete darkness (−Fe, dark), and (e) upon exposure to iron‐limited conditions under a normal photoperiod (−Fe, light). Images were obtained 3 days after treatment using the tile scan function of the confocal laser scanning microcope. Consecutive pictures were stitched using a 15% overlay at each border. Scale bars = 500 μm.
(f) In situ localization of ferric chelate reductase activity in the roots of Col‐0 seedlings under sufficient iron or iron‐limited conditions in darkness or light, 3 days after treatment. The magnified images on the right show induction of ferric chelate reductase activity specifically in the late maturation zone of iron‐deprived light‐grown seedlings.