Figure 1.

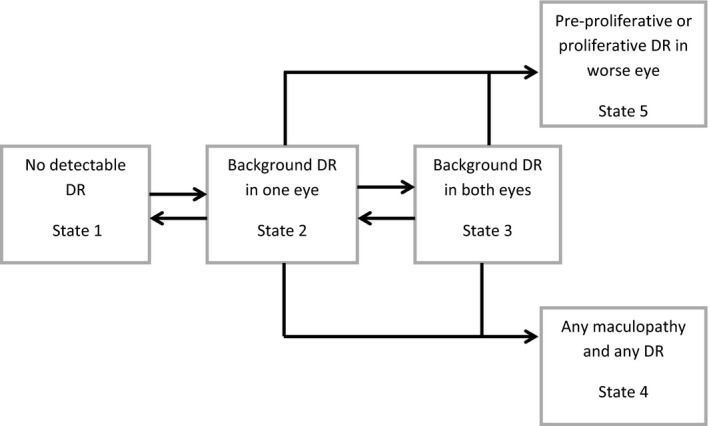
Graphical representation of the transition model. Arrows from one state to another represent instantaneous transitions to be estimated. Absence of arrows indicates instantaneous progression is not possible.

Graphical representation of the transition model. Arrows from one state to another represent instantaneous transitions to be estimated. Absence of arrows indicates instantaneous progression is not possible.