Figure 3.

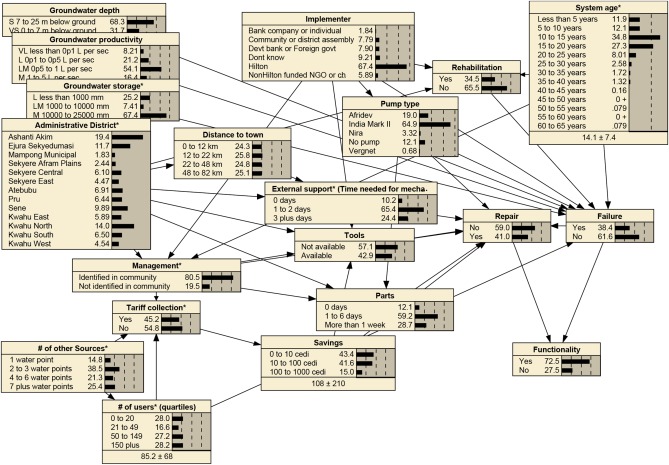
Bayesian network model. This Bayesian network model depicts the overall “baseline case” for the model, with the states of all nodes representing the distribution of states in the data set. Arrows indicate causal relationships in the model.

Bayesian network model. This Bayesian network model depicts the overall “baseline case” for the model, with the states of all nodes representing the distribution of states in the data set. Arrows indicate causal relationships in the model.