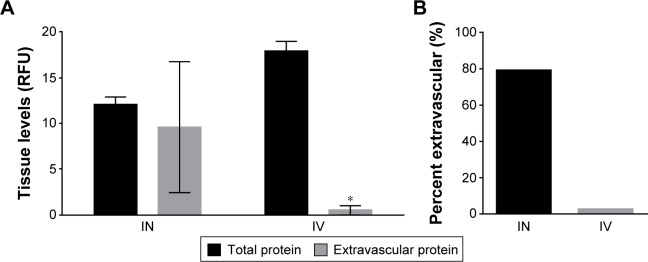
Figure 3.
Total extravascular ELP levels in the brain.
Notes: (A) Total ELP levels in unperfused (black bars) and perfused (gray bars) brains following IN and IV administration. (B) Percent of extravascular ELP. Data presented as mean ± SEM. *Statistically significant difference among polypeptide levels (n=4, P≤0.05, two-way ANOVA with post-hoc Tukey’s multiple comparison).
Abbreviations: ANOVA, analysis of variance; ELP, elastin-like polypeptide; IN, intranasal; IV, intravenous; RFU, relative fluorescence units; SEM, standard error of mean.

