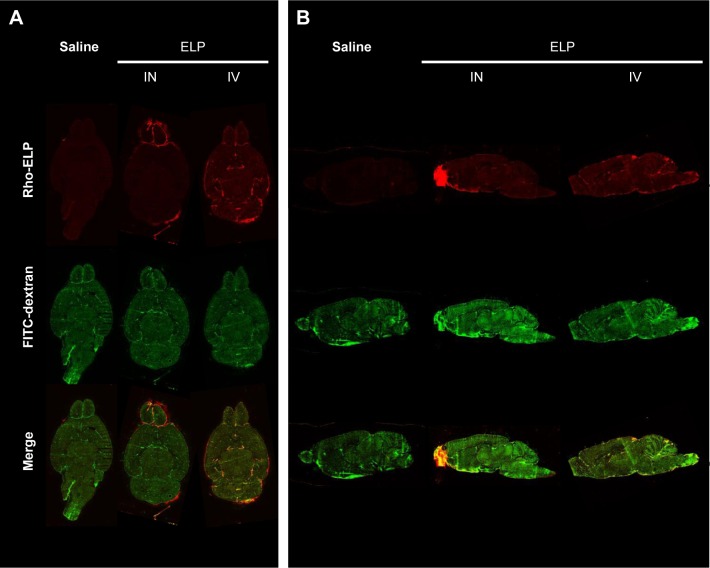
Figure 5.
Brain distribution of ELP following IV and IN administration.
Notes: Representative slide scan images from both axial (A) and sagittal (B) slices. Animals were injected with 1 mg FITC labeled 500 kDa dextran 1 minute prior to sacrifice in order to mark blood vessels. Slides were scanned with 541 nm and 488 nm excitation to image polypeptide and dextran, respectively.
Abbreviations: ANOVA, analysis of variance; ELP, elastin-like polypeptide; FITC, fluorescein isothiocyanate; IN, intranasal; IV, intravenous.

