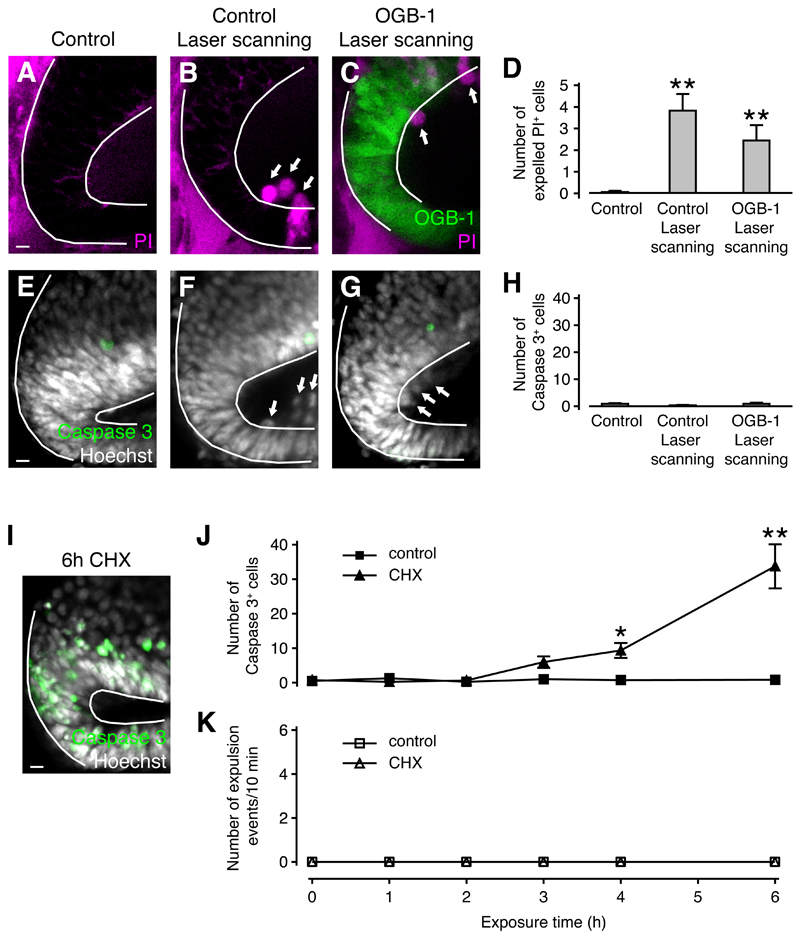
Figure 3. Necrotic but not apoptotic cell death triggers cell expulsion.
(A-C) Live images of the optic tectum loaded with PI (A,B) or OGB-1 and PI (C). Arrows indicate expelled cells. Scale bar represents 10 µm.
(D) Quantification of cell expulsion. n ≥ 16 animals in each condition. ** p < 0.01 in Kruskal-Wallis test with Dunn’s post test.
(E-G) The optic tectum fixed and stained for Caspase 3 and cell nuclei. Arrows indicate expelled cells. Scale bar represents 10 µm.
(H) Quantification of Caspase 3+ cells. n ≥ 8 animals in each condition. No significant differences were detected in Kruskal-Wallis test with Dunn’s post test.
(I) The optic tectum fixed and stained for Caspase 3 and cell nuclei after 6 h of CHX exposure. Scale bar represents 10 µm.
(J) Time course of Caspase 3 activation in control and CHX-treated animals. n ≥ 2 animals in each condition. * p < 0.05 and ** p < 0.01 in Kruskal-Wallis test with Dunn’s post test.
(K) Expulsion events in control and CHX-treated animals. n = 5 animals in each condition.
All population data are represented as mean ± sem.

